
Goals plus assists is a useful first line, but it cannot explain role, chance quality, possession work or the sample behind a player's output.
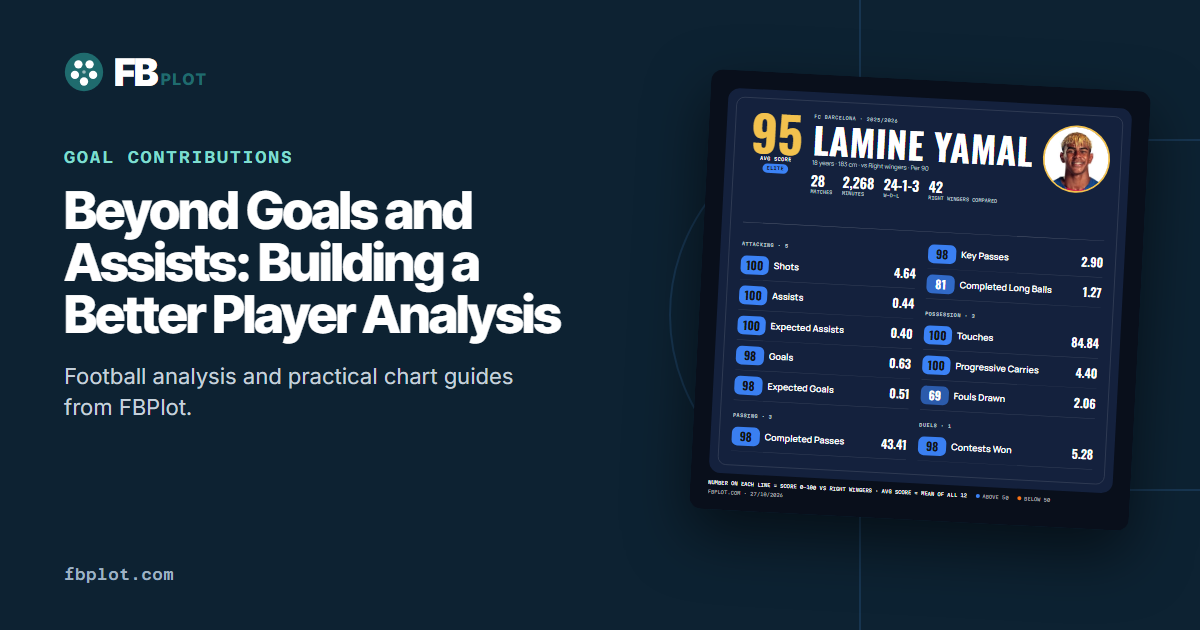
Learn how to keep Goals + Assists in a football analysis without letting one familiar total replace the harder questions about minutes, process, role and team context.
A recruitment note lands in your inbox with one sentence highlighted: “12 goals and 8 assists.” It is neat, familiar and instantly comparable. It is also where the analysis should begin, not where it should end.
Goals + Assists—usually shortened to G+A or described as goal contributions—combines two outcomes that matter enormously. The current FBPlot catalog treats Goals + Assists as its own attacking metric, which makes it useful for sorting and screening. The trouble starts when the sum is asked to explain how those contributions happened, how often the player was on the pitch, or what else the role required.
Two players can finish with the same G+A and have almost nothing else in common.
Start by Rebuilding the Denominator
The first question is not whether 20 contributions is good. It is: 20 contributions in how much football?
A total rewards availability and accumulated output. That may be exactly the point. A season review should care whether a player sustained production over 3,000 minutes rather than 700. A scouting comparison, however, may also need a rate to stop the longer sample from dominating by construction.
Read both views:
- the absolute total tells you what reached the scoreboard across the period;
- a per-90 rate tells you how frequently it happened while the player was on the pitch;
- minutes and starts tell you how much confidence to place in the rate.
Per 90 is not a correction that makes every player equivalent. It does not remove substitute effects, penalties, role changes or team strength. The per-90 guide explains why the denominator belongs beside the rate.
Split the Sum Back Apart
Adding goals and assists is convenient, but the components describe different events. A player with 15 goals and 5 assists presents a different question from one with 5 goals and 15 assists. The identical sum hides the balance.
That balance is still not the full story. Goals may include or exclude penalties depending on the selected metric definition. Assists rely on a teammate completing the chance, while a dangerous pass that is missed adds nothing to the assists column. Before making a comparison, verify the definition and keep the separate rows visible.
The point is not to dismiss G+A. It is to prevent arithmetic from erasing the route to the result.
Add a Process Layer
Once the outcome is clear, ask what repeated actions sit underneath it.
For finishing, that might mean shots, shots on target, expected goals and touches in attacking areas. For creation, it might mean key passes, expected assists, crosses or passes into advanced zones. These measures do not “explain” every goal or assist, but they help distinguish a repeatable pattern from a total driven by a small number of moments.
The next two guides go deeper into shots on target percentage and key passes versus expected assists. They are useful precisely because they do not collapse volume and quality into the same question.
Put the Role Back Into the Number
A winger holding width, a striker occupying centre-backs and a midfielder arriving late can all contribute to goals through different jobs. Ranking them only by G+A silently rewards the role with the shortest route to the final action.
Write one role sentence before choosing supporting metrics:
This player is expected to receive in wide areas, progress possession and create or finish attacks near the box.
That sentence gives the chart a purpose. Progressive carries may matter for the wide receiver. Box touches and shot quality may matter more for the central striker. A midfielder's contribution may need to include progression and defensive work that never produces a goal contribution.
The role-based metric guide shows how to build that hypothesis without pretending every position has one universal template.
A Bar Chart Makes the Missing Rows Visible
The FBPlot bar chart below uses an absolute-value profile for Erling Haaland in 2025/26. It is not included to reach a verdict about the player. It demonstrates a better editorial habit: keep the outcome rows visible, then let the reader inspect the surrounding attacking profile and the comparison context.
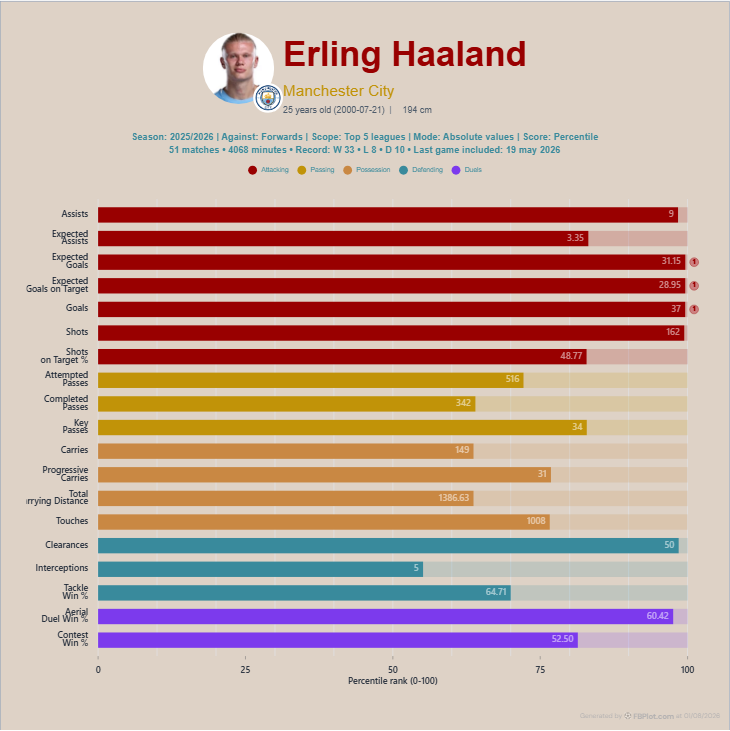
Bars are helpful here because they keep each metric on its own row. The eye does not have to infer an overall shape, and the written analysis can point to one observed value at a time.
Team Contribution Answers a Different Question
An individual rate asks how frequently the player recorded an event. Team contribution, where the metric supports it, asks how much of the team's output came through that player.
Those can move in different directions. A modest raw total may represent a large share in a low-volume team; a strong individual total may represent a smaller share in an attack with several productive players. Neither view is automatically fairer. They answer different questions.
Use contribution when the argument concerns responsibility inside the team. Use totals or per-90 values when the argument concerns accumulated output or event frequency. Do not switch between them halfway through a comparison.
A Practical Reading Order
When a player page or shortlist is sorted by G+A, use this sequence:
- Confirm period, competitions and minutes.
- Separate goals from assists and check the metric definitions.
- Compare absolute output with the appropriate rate.
- Add one finishing-process and one creation-process measure.
- Add the role-specific work the sum cannot see.
- Check whether team contribution changes the interpretation.
- State what the chart still cannot establish without video or match context.
This order prevents the supporting metrics from becoming a random collection. Each one answers a question created by the G+A total.
Keep the Headline, Improve the Paragraph
Goals and assists deserve a prominent place in football analysis because matches are decided by goals. The mistake is not using G+A; it is treating the sum as a complete description of the player.
A stronger sentence sounds like this:
The player's goal contributions establish the outcome. Minutes, rates, chance quality and role-specific actions show how that outcome was produced and how cautiously it should be projected.
Open the FBPlot Profile editor with the Bars design, place Goals + Assists beside its components, and add only the process metrics required by your role hypothesis. If the chart cannot explain why every row is present, it is not ready to leave the editor.
Found this helpful? Share it with your network
More Articles
Big Chances Created vs Key Passes: Two Views of Chance Creation
Key passes count final passes before non-scored shots under one provider convention; big chances created isolate a narrower high-quality subset.
Duels Won in Football: Meaning, Context and Common Mistakes
Duels won record successful contests, but totals and win percentage need role, opportunity, duel type, location and team context before ranking players.