
Fouls committed and fouls drawn describe opposite sides of an incident, but role, location, possession and game state decide what the counts mean.
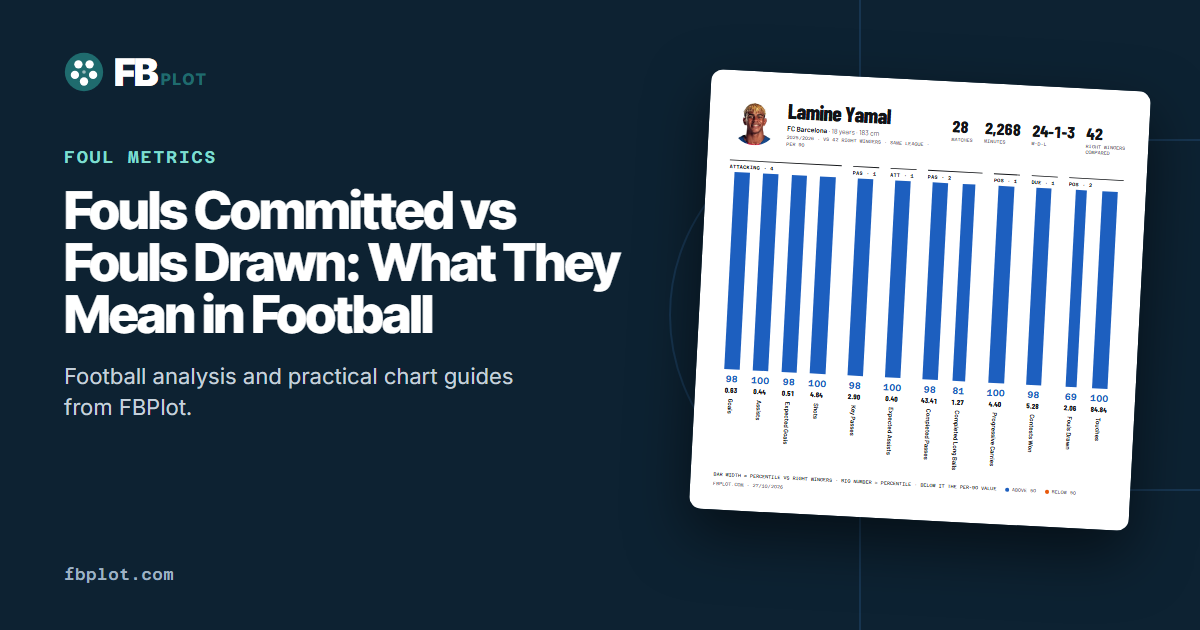
Learn how to read football foul statistics without treating every foul as indiscipline or every foul drawn as proof of attacking quality.
One midfielder stops a counterattack near the halfway line. One winger is clipped after beating a full-back. The match log records a foul committed for the first player and a foul drawn for the second, but the football meaning sits in the situation around the whistle.
Searches for “fouls committed meaning” often expect a dictionary answer. In player analysis, the useful answer goes one step further: the two counts identify who was penalised and who received the decision, not whether either player had a good match.
Fouls Committed and Drawn Are Related, Not Mirror Ratings
A foul committed is attributed to the player penalised for an infringement. A foul drawn is attributed to the opponent who receives the decision in datasets that record that field. Provider conventions can differ, especially around advantages, off-ball incidents and the player credited, so treat the source definition as part of the data.
The rows may be opposites within one incident, but they are not positive and negative versions of the same player skill. A high committed count can come from late defending, tactical interruption, aggressive pressing or simply more defensive exposure. A high drawn count can come from dribbling, shielding, receiving under pressure or being the obvious route out of possession.
Location Changes the Cost
A foul 70 metres from goal is not equivalent to one on the edge of the penalty area. The same count can conceal very different consequences:
- a transition is stopped before it becomes dangerous;
- a set piece is conceded in shooting range;
- a defender is isolated and accepts a card risk;
- an attacker protects possession near the touchline;
- advantage is played and the attack continues.
Without location and consequence, the count is an alert. It tells the analyst where to look in the match, not what conclusion to publish.
Opportunity Sits Under Both Metrics
Defenders in a low block may face more actions near their own goal. Pressing midfielders may make more challenges because their task is to engage early. Players in dominant teams may spend long spells without a defensive decision at all.
The same logic applies to fouls drawn. A player needs the ball, an opponent and a contested action before a foul can be drawn. Total touches provide one rough denominator; carries or contests can be more specific depending on the role. FBPlot's catalog includes Fouls Drawn per 100 Touches precisely because a possession opportunity question differs from a per-90 frequency question.
Do not turn that ratio into a universal quality score. Some players move the ball before contact; others invite it because their job is to retain possession under pressure.
Read Fouls Inside the Role
This FBPlot defensive-midfielder pizza keeps fouls and duels within a wider role profile rather than elevating them into a discipline grade.
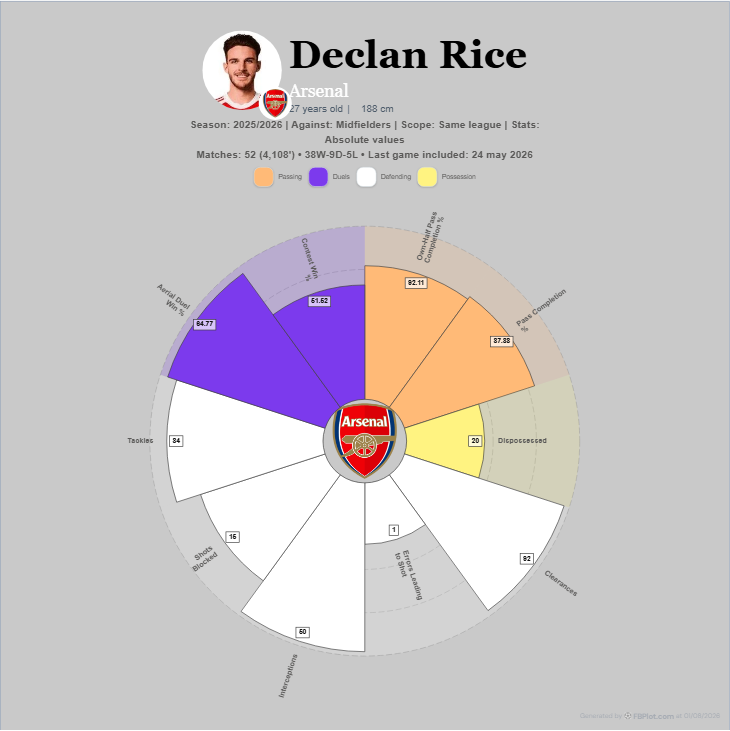
For a holding midfielder, pair fouls committed with tackles, recoveries, interceptions, duels and the team's defensive context. For a winger or full-back, add carries, contests and fouls drawn. A number becomes interpretable when it sits next to the actions that created the opportunity.
Cards Are Consequences, Not a Clean Denominator
It is tempting to divide fouls by yellow cards and call the result discipline. That calculation mixes referee decisions, foul severity, persistent infringement and match context. Two identical-looking contacts can produce different sanctions because of location, tactical effect or prior warnings.
Cards remain relevant, but they answer a consequence question. Fouls answer an event-frequency question. Video answers what actually happened.
A Better Comparison Paragraph
Suppose Player A commits more fouls per 90 than Player B. The weak conclusion is that Player A is less disciplined. A stronger analysis asks whether A also attempts more defensive actions, plays in a more transition-heavy team, or commits those fouls farther from goal.
Likewise, a player drawing many fouls may be an effective carrier, but the count alone cannot show whether the actions advanced play, relieved pressure or merely recycled possession.
The full-back statistics guide applies this distinction to a role that often alternates between duels and ball progression. The defensive-midfielder guide shows why defensive busyness must be separated from defensive quality.
Use a Two-Sided Foul Check
Before writing the final sentence, check the player on both sides of the whistle:
- committed and drawn counts, minutes and possession opportunity;
- role, team style and typical pitch zones;
- cards, set pieces conceded and transition context where available;
- match clips for the incidents driving the pattern.
Then write narrowly: “The player was frequently involved in foul incidents during this period, committing more while also drawing contact under possession.” That is evidence. “Dirty player” or “impossible to stop” is theatre.
Use the Fouls Committed metric page and Fouls Drawn metric page to keep the two measures distinct, then place them beside role-relevant rows in the FBPlot Profile editor, using a radial or bar design.
Found this helpful? Share it with your network
More Articles
Big Chances Created vs Key Passes: Two Views of Chance Creation
Key passes count final passes before non-scored shots under one provider convention; big chances created isolate a narrower high-quality subset.
Duels Won in Football: Meaning, Context and Common Mistakes
Duels won record successful contests, but totals and win percentage need role, opportunity, duel type, location and team context before ranking players.