
Player profile
Summarise strengths and weaknesses across several phases of play.
Allow anonymous usage analytics from Google Analytics and Microsoft Clarity to help improve FBPlot. Read the privacy policy.
Create a free pizza chart for one football player. Choose a season, comparison group and metrics, then customize and export a compact statistical profile.
Build the chart around an analytical question, then keep the setup visible when you share the result.
Search for one player and choose the season or period you want to analyse.
Select a comparison group and metrics that fit the player's role.
Review the profile, adjust the presentation and download the finished chart.
Summarise strengths and weaknesses across several phases of play.
Place a player against a relevant positional benchmark in one compact visual.
Present a player's statistical shape for a defined season or period.
Turn a multi-metric profile into a format suited to reports and social posts.
Percentiles describe where a player ranks inside the selected comparison population. Changing the position, competition, age or minutes filters can change every percentile even when the player's underlying output is unchanged.
Per-90 values normalise output by playing time, absolute values preserve totals, and team contribution describes the player's share of team activity. Per-best scores compare each value with the strongest result in the reference group.
A pizza chart is most useful as a compact profile. It should be read alongside role, minutes and competition context rather than as an overall player rating.
Each example changes the analytical setup, not only the colours. Player statistics shown in the images are labelled with their season.
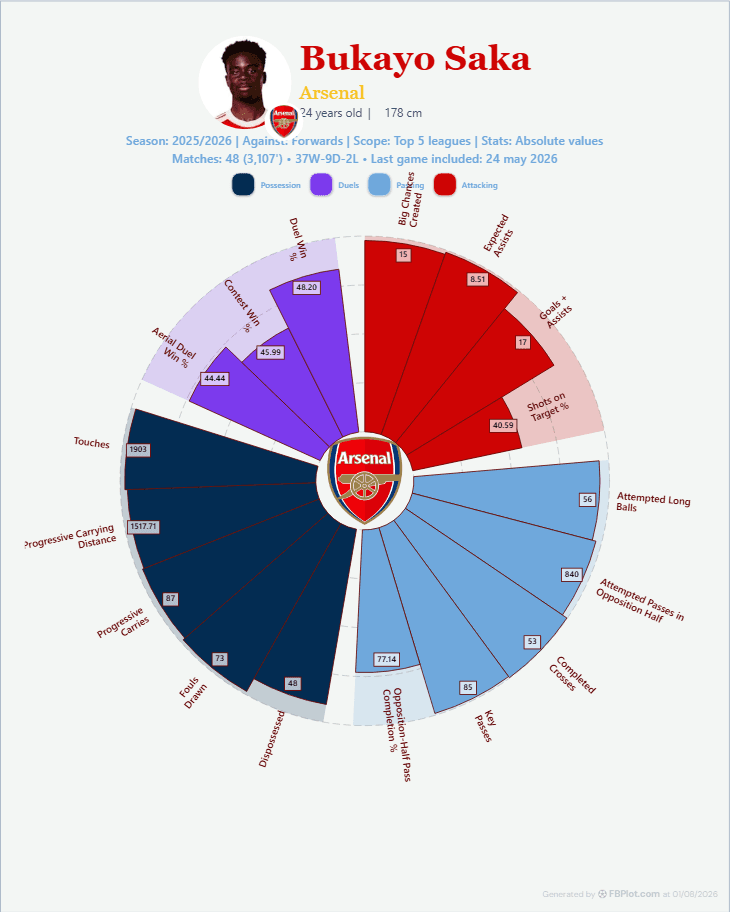
Balance carrying, chance creation and shooting metrics for a wide attacker.
Winger metrics · Per 90 · Percentile
Use this setup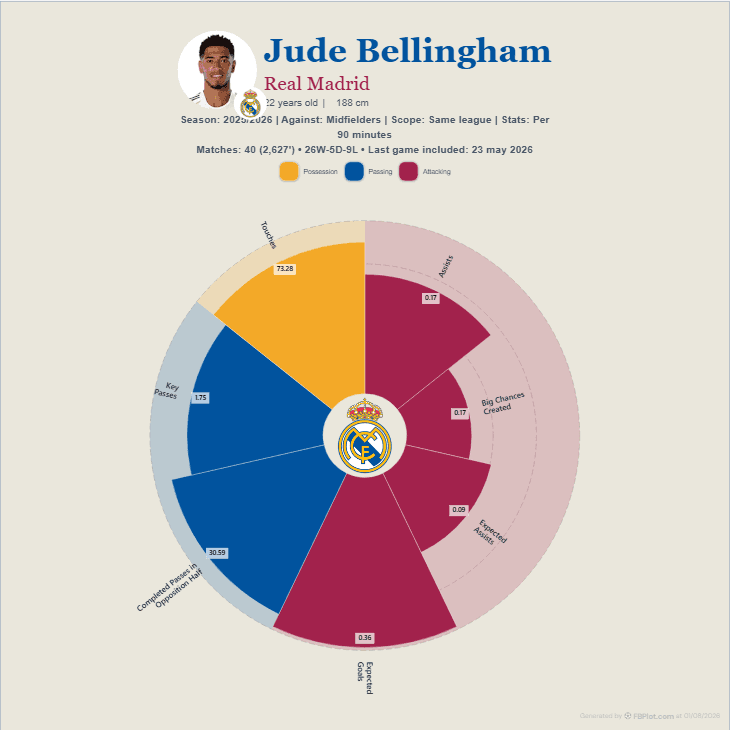
Focus the chart on passing, progression and chance creation.
Creator metrics · Per 90 · Percentile
Use this setup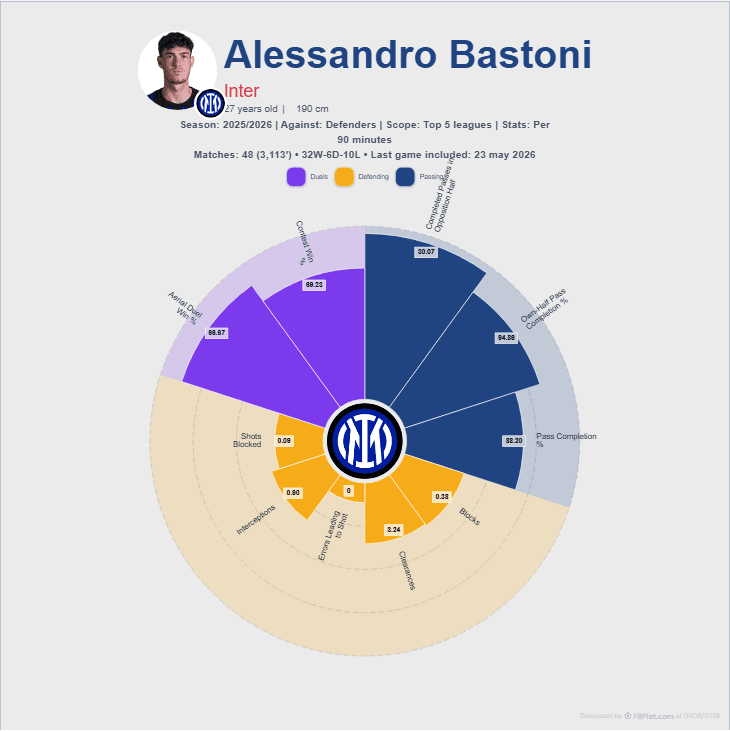
Combine defensive actions, aerial work and ball progression for a defender.
Defender metrics · Per 90 · Percentile
Use this setupCheck the metric definitions and methodology before publishing a comparison.
This tool profiles one player. Use Player Comparison when you want two or three player-season profiles on the same radar.
It is the player's position inside the selected reference population. A 90th percentile value means the player ranks above roughly 90 percent of that group for the metric.
Use totals to communicate accumulated output and per-90 values to compare rates while accounting for playing time. Always keep minutes and role in view.
Yes. The free editor supports player selection, chart configuration and image export without registration.
FBPlot Pro adds saved charts, reusable metric and style presets, and access to every available competition.