
Pass completion percentage measures successful attempts in a selected pass set. It does not reveal difficulty, direction, pressure or creative value.
Read passing accuracy with attempted volume, pitch zone, role, risk and progression so a tidy percentage does not become a false quality ranking.
The safest passer in a match is not necessarily the best passer. Sometimes it is the centre-back recycling possession without pressure. Sometimes it is the midfielder who refuses the difficult ball the team needs.
Pass completion percentage is precise arithmetic wrapped around an incomplete football question. It tells us how often attempted passes in the selected set were recorded as successful. It does not tell us what the passes tried to achieve.
How Passing Accuracy Is Calculated
Opta's event documentation describes pass completion as successful passes divided by total attempted passes for the selected combination of passes. The phrase “selected combination” matters: filters for pass type, zone or phase change the denominator.
Other providers can use different event boundaries. Crosses, throw-ins, set pieces and deflections may not be handled identically, so do not compare percentages from two sources as if the collection rules were invisible.
FBPlot's current catalog separates Completed Passes, Attempted Passes and Pass Completion %. It also offers own-half, opposition-half, long-ball and crossing variants. Those splits are more informative than treating every pass as one task.
A High Percentage Can Be a Low-Risk Role
A centre-back facing a settled block may make dozens of short lateral passes. A number ten receiving between the lines may attempt fewer passes while trying to break the defence. If the second player completes a lower share, the percentage may be describing the difficulty of the job rather than inferior technique.
This is the central trap: accuracy rewards both execution and selection. Players choose—or are instructed—to attempt passes with different levels of risk.
Before comparing two percentages, write one sentence for each passing role. Who receives under pressure? Who is expected to switch play, enter the box or preserve possession? If the jobs are different, the comparison should describe that trade-off.
Volume Keeps the Denominator Honest
A player completing nine of ten passes has 90% accuracy. Another completing 90 of 105 has a lower percentage but moves the ball successfully ten times as often. The ratio and the workload answer different questions.
Keep completed and attempted passes beside the percentage. If minutes are unequal, inspect both totals and rates. A small number of attempts can make the percentage jump sharply from one match to the next.
Do not normalise Pass Completion % per 90. It is already a ratio, and the current FBPlot catalog correctly disables that mode. Use per-90 counts for completed or attempted passes when frequency is the question.
Zone and Direction Reveal Ambition
Completion in a player's own half and completion in the opposition half should not be expected to behave the same way. Space contracts, pressure rises and passing lanes become more valuable closer to goal.
Long balls and crosses form other distinct tasks. A low cross-completion rate may still produce valuable chances; a high long-ball rate can reflect selective use rather than superior range. The percentage needs the type and destination of the attempt.
If progressive-pass data is unavailable or provider definitions differ, avoid inventing a proxy from generic forward passes. State which current rows you are using and what they leave unresolved.
Read a Playmaker as a Sequence
This FBPlot pizza places passing frequency and creative output inside a broader midfielder profile.
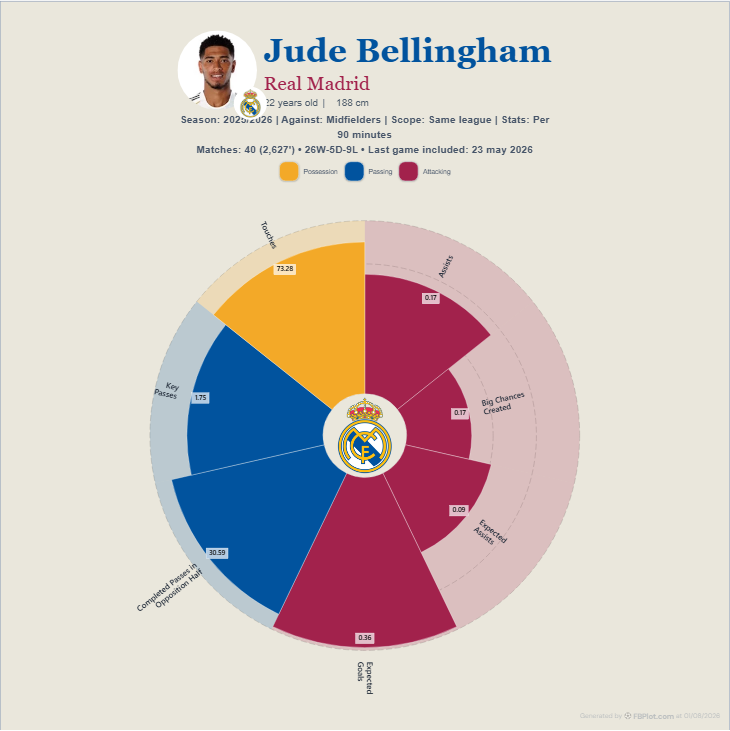
The useful reading order is attempted involvement, completion, progression and then chance creation. A percentage cannot tell that story alone. The attacking-midfielder statistics guide develops the sequence around a specific role.
Team Style Changes the Passing Menu
Possession-heavy teams create repeated short options and often push opponents deeper. Direct teams ask players to cover territory with fewer passes. Press-resistant teams may deliberately invite pressure before finding the free player.
The passing percentage therefore belongs partly to the team. When comparing players from different environments, include team possession, tempo and build-up role—or say clearly that those controls are unavailable. The different-team-styles comparison guide provides a practical adjustment framework.
Do Not Turn “Lower Is Better” Into the New Shortcut
Once analysts learn that safe passing can inflate completion, they sometimes romanticise a low rate as evidence of bravery. That is the same mistake in reverse. Failed passes can be ambitious, careless, forced or poorly executed.
The point is not to reward risk automatically. It is to separate the decision to attempt a pass from the execution of it, then judge both against the role.
A Better Passing Conclusion
Replace “Player A is the better passer because he completes 92%” with something the chart can support:
Player A completed a greater share of a high-volume passing workload in this period. Most of the available evidence describes circulation; opposition-half and chance-creation rows are needed before comparing ambition and attacking value.
That sentence preserves the strong evidence and refuses the unsupported leap.
Start with the Pass Completion % metric page, then use the Player Bar Chart to compare completion with attempts, opposition-half passing, long balls, crosses and key passes. Accuracy becomes meaningful when the attempted job is visible.
Found this helpful? Share it with your network
More Articles
Shots Off Target in Football: What the Stat Actually Tells You
Shots off target describe an attempt's outcome, not its danger or the quality of the finish. Read the number with volume, location, blocks and role.
Team Contribution in Football Metrics: What a Player's Share Reveals
Team contribution shows a player's share of supported team activity. It adds structural context but does not prove efficiency, quality or causation.