
Transfer targets
Compare candidates against the same role-specific set of metrics.
Allow anonymous usage analytics from Google Analytics and Microsoft Clarity to help improve FBPlot. Read the privacy policy.
Compare two or three players, or the same player across seasons, with a customizable football radar chart. Choose the metrics and reference population, then export or share the comparison.
Build the chart around an analytical question, then keep the setup visible when you share the result.
Choose two player-season profiles, with an optional third profile for a shortlist.
Select metrics and a reference population that match the roles being compared.
Read the overlap and values, then download the chart or copy its reproducible URL.
Compare candidates against the same role-specific set of metrics.
Place two player-season profiles on shared axes for a direct visual comparison.
Select the same player in two seasons to inspect changes in profile.
Add a third profile to compare a small group without changing the axes.
A useful comparison starts with a clear question. Choose metrics and a reference population that match the players' roles, competition level and playing time.
Percentile and per-best scores describe performance relative to a selected population. Per-90, absolute and team-contribution modes answer different questions and should not be mixed without explanation.
Polygon overlap shows where profiles are similar, not whether one player is universally better. Missing metrics, tactical responsibilities and sample size still need to be considered.
Each example changes the analytical setup, not only the colours. Player statistics shown in the images are labelled with their season.
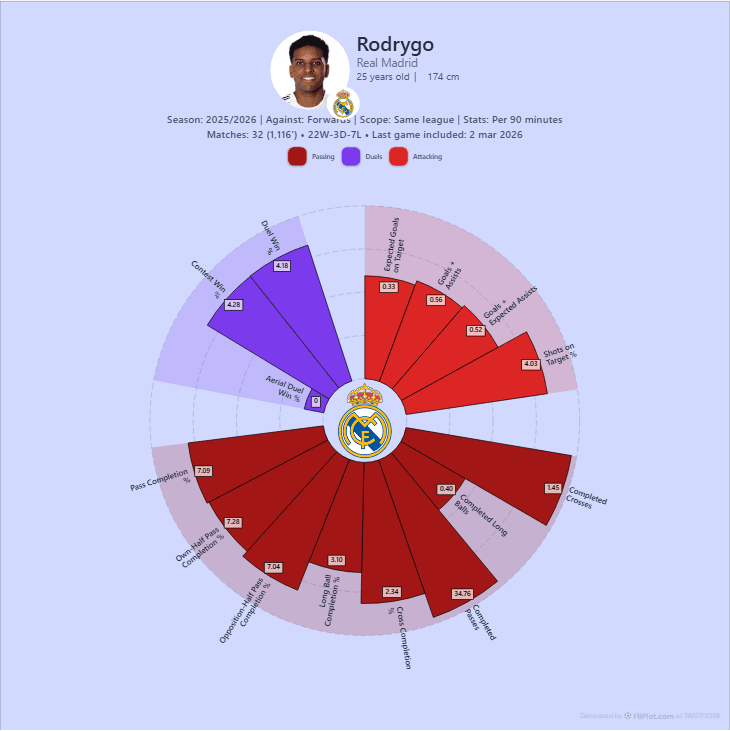
Hold the league and position constant to compare two players against a narrower population.
Same league · Per 90 · Percentile
Use this setup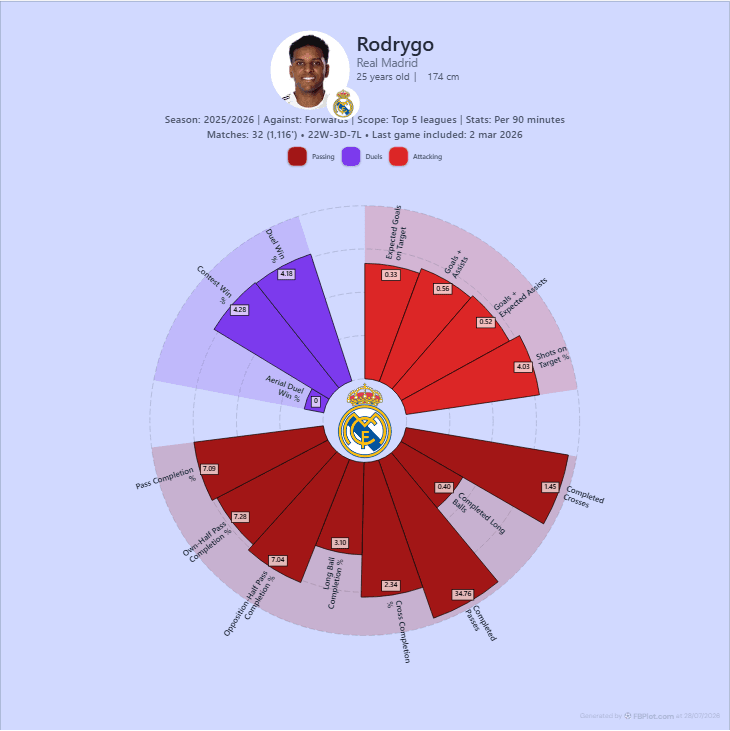
Use a broader population to compare profiles across Europe's five major leagues.
Top Five leagues · Per 90 · Percentile
Use this setup
Keep the metric set stable and compare how one player's profile changes over time.
Two seasons · Shared axes · Role-specific metrics
Use this setupCheck the metric definitions and methodology before publishing a comparison.
You can compare two or three player-season profiles on the same axes.
Yes. Select the same player more than once and choose a different season for each profile.
The public tool supports players from the Premier League, LaLiga, Serie A, Bundesliga and Ligue 1.
No. The shape depends on the selected metrics, value mode and reference population. It supports a specific comparison, not a universal player ranking.
FBPlot Pro adds saved charts, reusable metric and style presets, and every available league and competition.