
Key passes count final passes before non-scored shots under one provider convention; big chances created isolate a narrower high-quality subset.
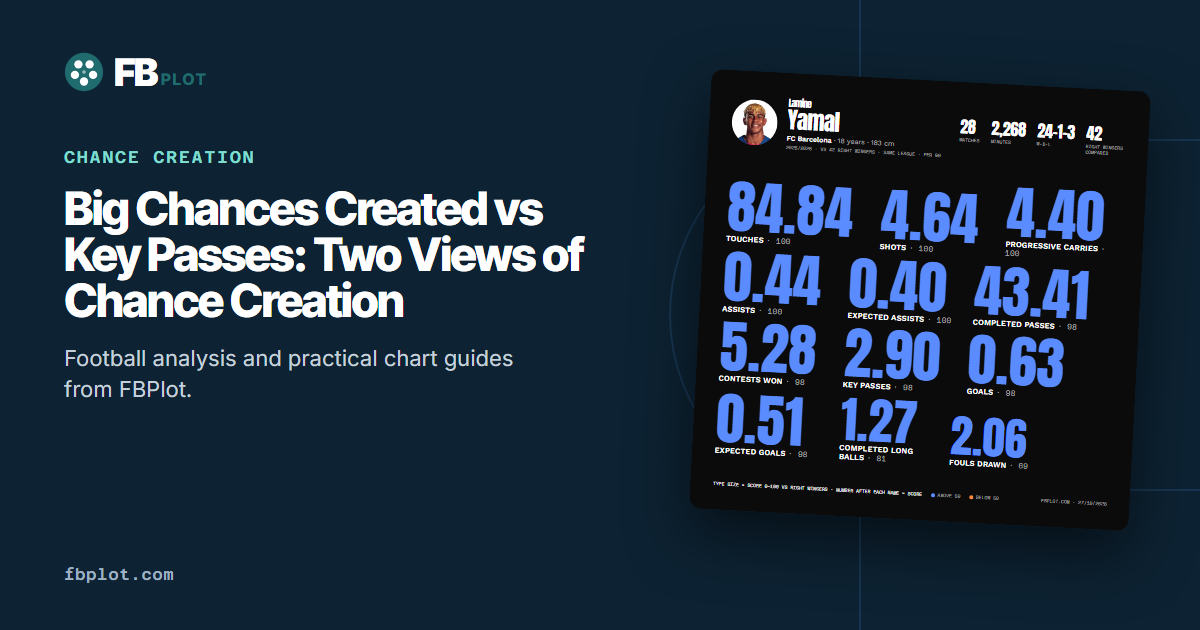
Learn when volume and high-quality chance labels agree, why provider definitions matter, and how to avoid ranking creators from one count.
One creator slips a striker through twice in a match. Another lays off six attempts from distance. The second player can lead the key-pass count while the first created the clearer openings.
That is not a flaw in either metric. Key Passes and Big Chances Created are designed to describe different slices of creation.
Start With the Provider's Definitions
In Opta's event definitions, a key pass is the final pass to a teammate who then shoots without scoring; chances created combine assists and key passes. A big chance is a situation in which a player would reasonably be expected to score, typically with a clear path and limited pressure.
Those are provider-specific operational definitions. Other datasets may credit assists within key-pass totals or use different rules for big chances. If two sites disagree, the difference may begin in methodology rather than error.
FBPlot currently lists Key Passes and Big Chances Created as separate attacking/passing measures. Keep them separate in the analysis too.
Key Passes Describe Frequency
Key-pass volume answers how often a player's final pass led to a recorded shot under the chosen definition. It rewards repeat creation even when the shots are difficult or poorly converted.
That makes it useful for identifying consistent involvement. It also means ten key passes are not ten equal chances. A short layoff for a speculative effort and a pass that removes the goalkeeper can occupy the same count column.
Attempted passes and touches help describe opportunity. Key Passes per 100 Attempts, available in the current FBPlot catalog, asks how frequently a pass attempt became a shot assist. It does not automatically grade the shots.
Big Chances Created Narrow the Lens
Big-chance counts focus on openings judged to be particularly strong under the provider's criteria. They can reveal a creator whose smaller number of passes produce clearer opportunities.
The label also contains judgement. “Big” is not a universal natural category; it comes from an operational process. Use it consistently within one source and avoid presenting the threshold as provider-independent truth.
Because these events are rarer, the count can be volatile. One match with two clear openings can reshape a short sample.
Expected Assists Adds a Continuous Estimate
Expected assists can value shot outcomes along a scale rather than placing them only inside or outside a big-chance category. It offers another view of chance quality, subject to the model and provider.
Use the three together when available:
- key passes for shot-creating frequency;
- big chances created for a narrower high-quality event class;
- expected assists for modelled chance value.
The key passes versus expected assists guide explores the last pair in more detail.
A Playmaker Profile Makes Disagreement Useful
The FBPlot playmaker pizza below keeps passing, possession and attacking rows in the same visual field.
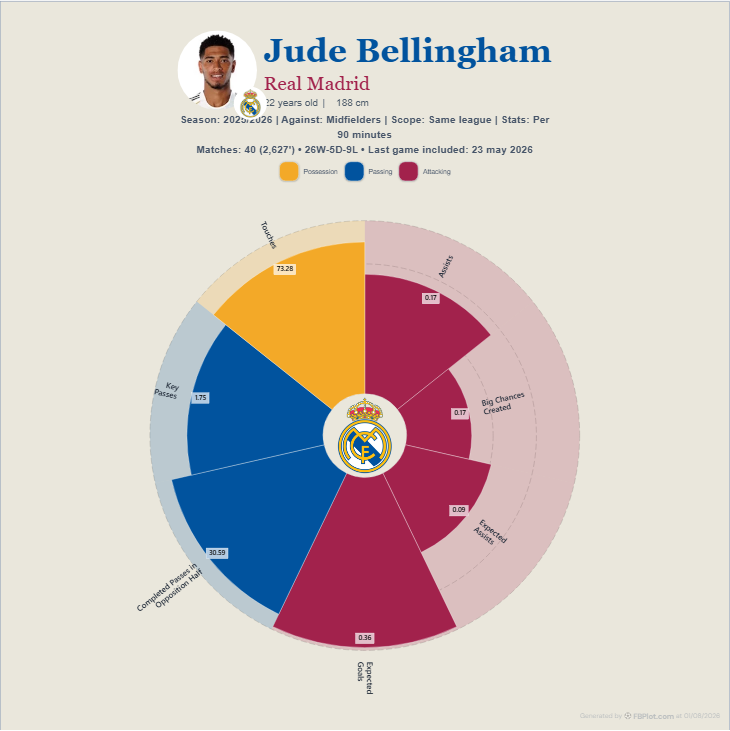
Do not add the rows into a “creativity score.” Ask why they agree or disagree. High key-pass volume with fewer big chances can describe frequent low-value creation. A smaller key-pass total with strong xA or big-chance output can describe selective, high-value creation.
Assists Are the Outcome, Not the Missing Definition
An assist depends on the teammate scoring and on the provider's attribution rules. It can validate that a chance became a goal, but it cannot tell us that every unconverted chance was poor.
A creator with many key passes and modest assists may have supplied difficult shots, suffered teammate under-conversion or simply experienced variance. Review the chance-quality measures and clips before choosing among those explanations.
Role and Delivery Method Still Matter
A winger creating from cut-backs, a midfielder playing through balls and a full-back crossing from deep can reach similar totals through different mechanisms. Recruitment decisions need the mechanism because it determines tactical fit.
The attacking-midfielder guide organises creation around reception, progression and the final action. The team-contribution guide adds whether the player supplies a large share of the team's supported output.
Write the Difference, Not a Winner
A useful conclusion sounds like this:
The player generated shots frequently, but a smaller share entered the provider's big-chance category. His value in this sample appears to be repeat creation rather than a high concentration of clear openings; expected assists and video should test that reading.
No metric has to “win.” Their disagreement is the analysis.
Open the Big Chances Created metric page and Key Passes page, then compare them in a bar design of the FBPlot Profile editor with assists, expected assists, attempted passes and minutes visible.
Found this helpful? Share it with your network
More Articles
Duels Won in Football: Meaning, Context and Common Mistakes
Duels won record successful contests, but totals and win percentage need role, opportunity, duel type, location and team context before ranking players.
Expected Goals on Target vs xG: What Changes After the Shot?
Expected goals describes pre-shot chance quality; expected goals on target adds information about the on-target execution. They answer different questions.