
Cross-level player comparison needs role, opportunity, population and match context. There is no honest universal coefficient for translating a statistic upward.
Build a transparent second-division-to-top-flight comparison using stable metrics, multiple populations, video and uncertainty rather than a hidden league multiplier.
The recruitment meeting reaches a familiar question: “Will these numbers translate to the top flight?”
No chart can answer that directly. A second-division player faces a different mix of opponents, teammates, tempo, tactics and opportunity. Multiplying every value by a fixed league-strength coefficient may look scientific, but without a validated model it hides more judgement than it removes.
If the evidence comes from a knockout tournament rather than a league season, solve that sampling problem first with the guide to comparing cup players with uneven minutes. Competition level and cup exposure are separate questions.
A useful comparison keeps the contexts separate, identifies what appears stable and directs the next stage of scouting.
Start With the Football Job
Align the role before the league. A high-touch playmaker in one division should not be compared casually with a transition runner in another simply because both are labelled midfielders.
Write the target role in the buying team's language:
Receive under pressure, progress through central areas and create without requiring a high share of possession.
Now choose measures tied to that job. The comparison becomes “evidence for this role in two environments”, not “whose radar is larger?”
Keep the Raw Contexts Visible
For each player, record:
- competition and season;
- team and typical possession context;
- role and position group;
- matches, minutes and starts;
- total and per-90 values;
- comparison population and exposure rule;
- opponent and tactical notes from video.
Do not merge the rows into one adjusted score before the reader can inspect them.
Percentiles Are Local to Their Populations
A 90th-percentile value in a second division means the player ranks highly among that selected population. A 70th-percentile value in a top flight refers to another distribution.
The numbers are not a direct statement that the first performance is stronger. They show relative standing in different contexts.
Use percentiles to answer: “How unusual is this profile among current peers?” Use raw or per-90 values to answer: “What was actually recorded?” Keep both.
See How Population Alone Changes a Radar
FBPlot's paired captures below do not compare divisions; they isolate the population principle. The player's recorded configuration stays fixed while the comparison scope changes.
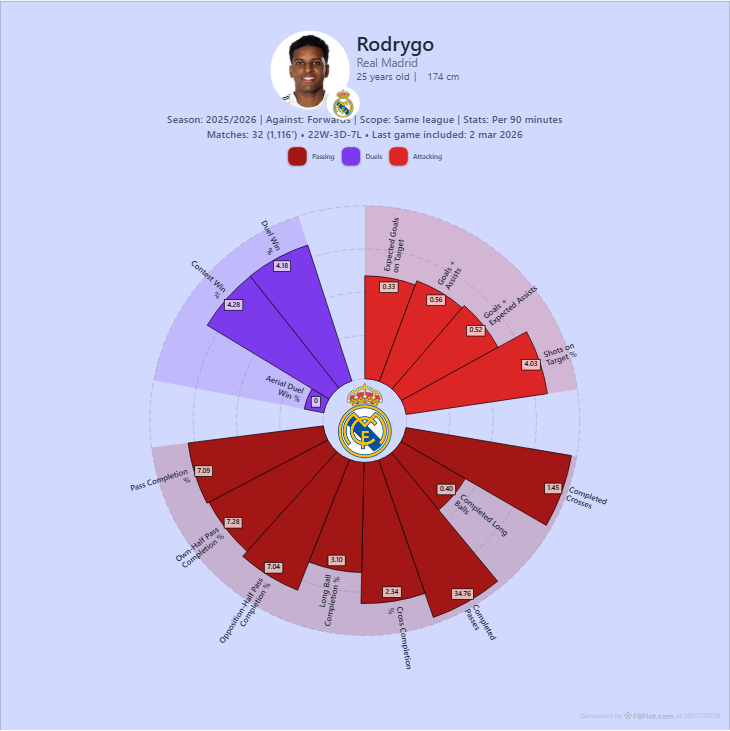
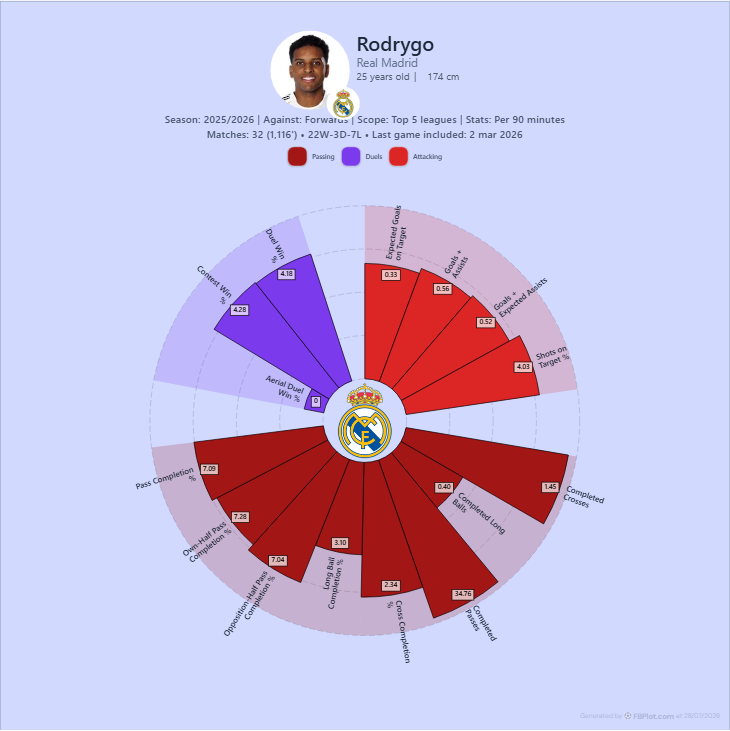
This is why population belongs in every cross-level caption.
Prefer Stable Mechanisms Over One-Season Outcomes
Goals and assists matter, but they can be influenced by finishing streaks, teammate conversion and a small number of events. Add process measures that describe how the output was created.
For a winger, inspect receiving, carries, chance creation and shot selection. For a midfielder, inspect progression routes and pressure context. For a defender, inspect exposure and distribution as well as interventions.
The role guides for wingers, defensive midfielders and centre-backs provide starting frameworks.
“Stable” does not mean guaranteed to transfer. It means the mechanism can be observed repeatedly and tested against the target role.
Opponent Context Belongs in Video Review
Ask how the player responds when time and space disappear. Review matches against stronger pressing teams, deeper blocks and direct opponents who resemble the target league challenge.
Look for decision speed, first touch, scanning, recovery after loss and whether the statistical strength survives under pressure. These are not all captured reliably by season event totals.
Choose disconfirming matches, not only the best clips.
Avoid the Universal League Multiplier
A single coefficient assumes that every metric and role translates in the same way. Shooting, aerial duels, ball progression and pass completion face different environmental changes. Even a well-designed league-strength model should disclose its data, outcome target and validation period.
If no validated model exists, use scenarios rather than false precision:
- observed second-division value;
- conservative expectation;
- questions that would make the estimate rise or fall.
Label scenarios as judgement, not measured fact.
Compare More Than One Reference Player
One successful transfer can create a misleading analogy. Build a reference set of players with similar roles and career stages, including unsuccessful or mixed transitions when evidence is available.
The purpose is not to find a perfect twin. It is to understand the range of pathways and which contextual variables mattered.
A Two-Stage Shortlist
Stage one asks whether the player is unusual and effective in the current division. Stage two asks whether the underlying mechanisms and physical/tactical demands fit the target environment.
Keep separate scores or notes for the two stages. A player can be an outstanding current performer and a poor fit for one top-flight role. That is a recruitment conclusion, not a statistical contradiction.
The Conclusion Should Preserve Uncertainty
The player ranks strongly among current same-division peers and records a progression profile relevant to the target role. The comparison does not apply a universal league adjustment; translation risk remains centred on pressure, opportunity and tactical responsibility, which will be tested through match review and reference cases.
That wording makes the remaining work explicit.
Use FBPlot Player Comparison to build separate same-league profiles before creating any wider-scope chart. For a broader method, read comparing players across leagues and document every population change.
Found this helpful? Share it with your network