
An isolated football scatter point is a question, not an answer. Check sample, role, data quality and match context before calling it a scouting discovery.
Use a reproducible outlier-review sequence to separate unusual player profiles from small samples, filter mistakes, role differences and data problems.
The isolated dot in the top-right corner is irresistible. It looks like the player everyone else has missed.
Sometimes it is. Sometimes the player has 240 minutes, takes every set piece, is classified in the wrong position, or inherited a data duplication. A scatter plot is excellent at making unusual observations visible and terrible at explaining why they are unusual.
Treat the outlier as the start of an investigation.
First Confirm That the Point Is Real
Before opening video, audit the row:
- correct player, club and season;
- correct competition scope;
- minutes and matches;
- total versus per-90 mode;
- metric definition and unit;
- duplicate or missing records;
- role and position classification.
A point generated by a filter error is not a football insight. Save the chart configuration so the check can be repeated.
Exposure Can Create Extreme Rates
Small samples produce volatile rates. A substitute can record two decisive actions in limited minutes and lead a per-90 axis. That observation is accurate for the sample; the projection may not be stable.
Use a pre-declared minutes rule and, when discovery requires a lower floor, encode minutes or label the sample. The guide to minutes as bubble size offers one way to keep exposure visible.
Do not delete every low-minute point after seeing it. Change the rule openly and compare both plots.
Role Differences Can Look Like Outliers
A full-back classified with centre-backs may lead progressive carries. A winger playing centrally may lead shots among wide players. The unusual point can reveal a hybrid role rather than exceptional all-round performance.
That is still useful. Rewrite the question: “Why does this player's role produce a different action profile?” Then choose a more coherent comparison group or make the role difference the finding.
A Real Scatter With Visible Isolated Points
The FBPlot chart below contains several highlighted players away from the main cloud. The labels help the reader locate them, but the plot does not explain the distance.
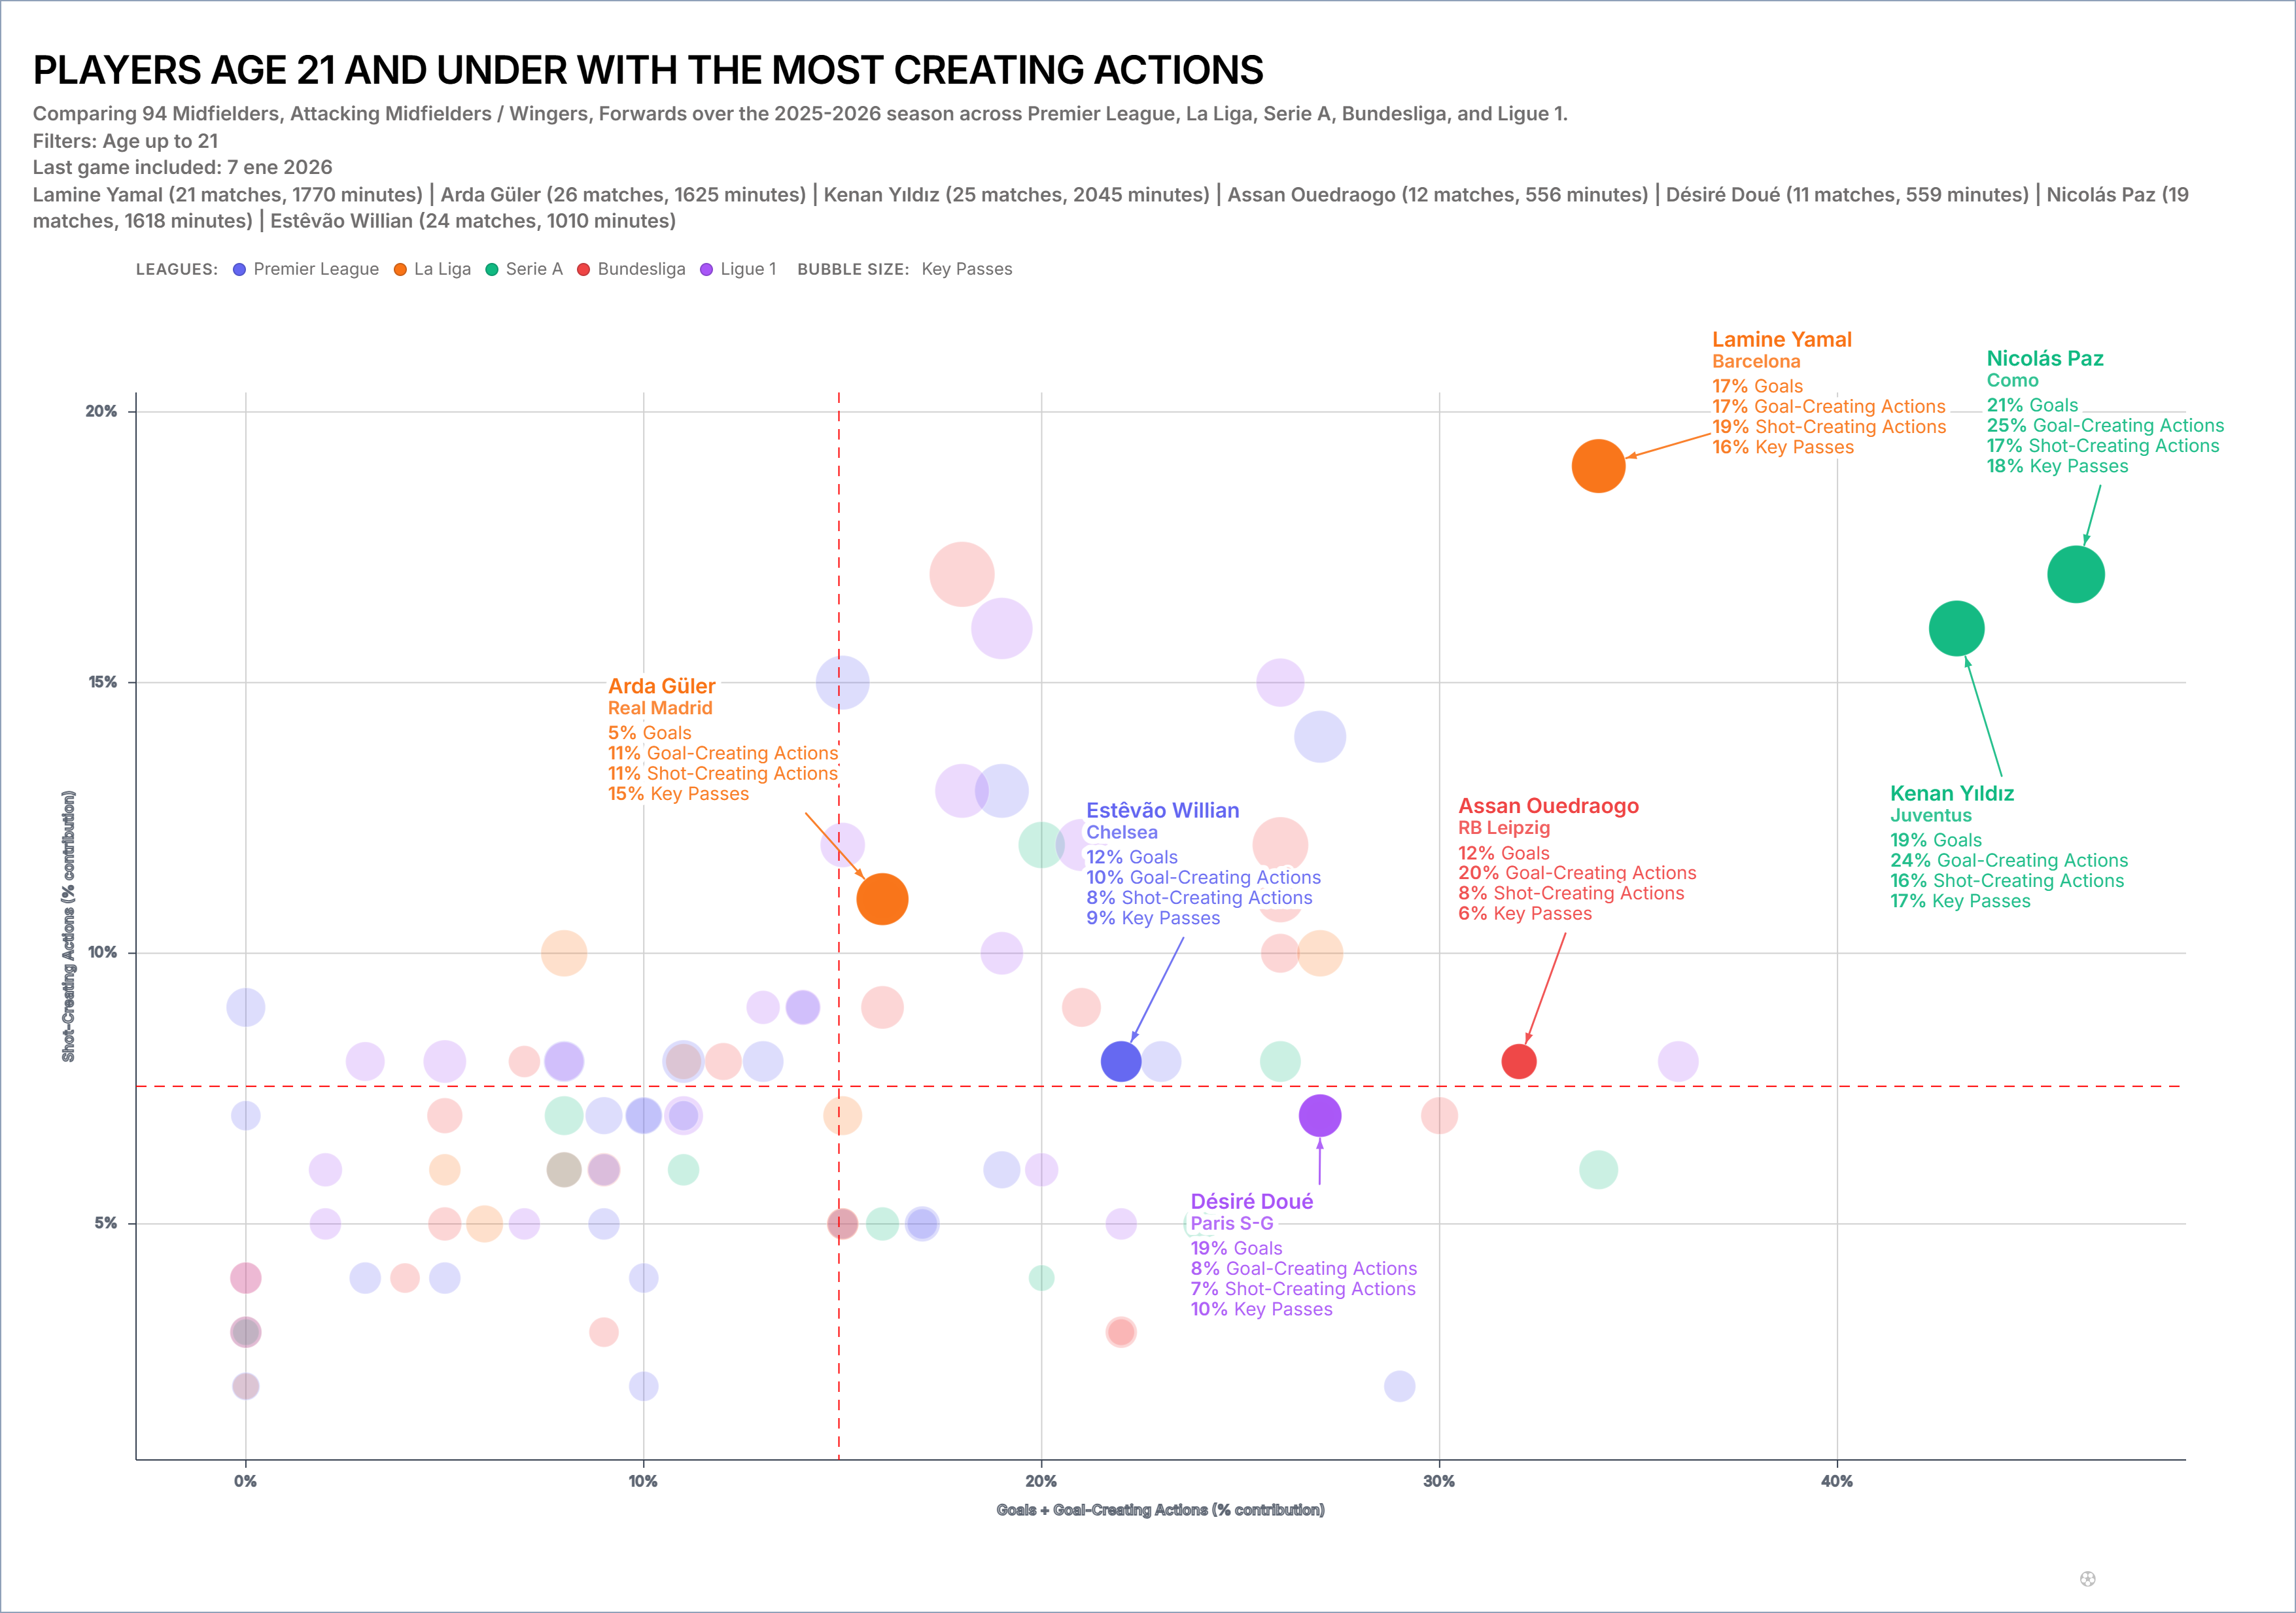
An outlier is relative to this chosen sample. Change age, positions, leagues or axes and the point's isolation may disappear.
Check the Metric Pair
Two correlated measures can produce a narrow diagonal cloud and make a modest deviation look dramatic. Two unrelated measures can create apparent isolation without a meaningful football story.
Ask why the axes belong together. A good pair represents a tactical trade-off or combination: volume and efficiency, creation and progression, attacking output and exposure.
If the connection cannot be stated, the outlier may be a product of arbitrary axis selection.
Investigate the Matches Behind the Point
Sample several matches across the period, not only the clips that confirm the chart. Look for:
- repeated starting zones;
- set-piece responsibility;
- game-state effects;
- opponent strength and tactics;
- role changes after substitutions;
- whether the action produces the expected advantage.
Record disconfirming examples. A compelling scatter position can create confirmation bias before the first clip is played.
Rebuild the Plot Three Ways
Test the outlier under controlled changes:
- raise the minimum-minutes rule;
- narrow the role population;
- change one axis from total to rate or from rate to an opportunity-based measure.
If the player remains unusual, the case is more robust. If the point returns to the cloud, document which context created the original result.
This is sensitivity analysis in plain language.
Distinguish Statistical From Practical Distance
A visually isolated point may differ by a small raw amount when the axis range is narrow. Read the values and scale. Conversely, two points that look close may represent a meaningful difference if the measure is difficult to move.
Do not use pixel distance as a football effect size. Add labels or a supporting table for the candidates under discussion.
From Outlier to Shortlist
An outlier can enter a shortlist when:
- the data row is valid;
- the sample meets the declared rule or uncertainty is acceptable;
- the role explains rather than invalidates the comparison;
- match review confirms a repeated mechanism;
- the unusual trait solves a real squad problem.
It should not enter simply because it is far from the median.
Write the Finding as a Question
Use:
Player A is isolated on the selected creation/progression plot. The next review will test whether the position is sustained across minutes, roles and matches.
Avoid:
Player A is the hidden gem in the dataset.
The first sentence creates an audit trail; the second turns geometry into a transfer recommendation.
Use the FBPlot scatter plot workflow to save the original population and the three sensitivity versions. For distribution context around one metric, pair the result with a football swarm plot rather than adding another unexplained axis.
Found this helpful? Share it with your network
More Articles
Football Scatter Plot Quadrants Without Arbitrary Winners
Quadrant lines organise a football scatter plot, but the threshold and axis direction determine whether “top right” has any useful meaning.
Using Minutes as Bubble Size in a Football Scatter Plot
Bubble size can keep playing time visible in a football scatter plot, but it does not replace an exposure filter or make a small sample reliable.