
Quadrant lines organise a football scatter plot, but the threshold and axis direction determine whether “top right” has any useful meaning.
Learn how to choose medians, targets or domain thresholds, label quadrants honestly and avoid turning two metrics into an undocumented player rating.
Draw one vertical line and one horizontal line through a scatter plot and four stories appear. “High-high” becomes the desirable corner, “low-low” the weak one, and the other two become specialist profiles.
The geometry is useful. The labels can be dangerously confident.
A quadrant line is a threshold chosen by the analyst or computed from the selected data. Move the population, period or threshold and players can cross from one story to another without recording a new action.
Decide What the Lines Mean
Common choices include:
- Median: half the eligible observations sit on either side of each line.
- Mean: the arithmetic average, sensitive to extreme values.
- Domain target: a threshold tied to a tactical or recruitment requirement.
- Fixed benchmark: a value retained across comparable periods.
None is automatically correct. A median describes this population; it does not define good football. A domain target can support a decision, but its origin must be recorded.
Do not place the lines where they create the most attractive shortlist.
“Top Right” Is Not Always Better
If both axes are measures where higher values support the question, the top-right region may be desirable. But some metrics have a lower-is-better direction, and others describe style rather than quality.
A plot of Fouls Committed against Defensive Errors cannot be read with a simple “higher is better” frame. A plot of carries against passes may describe two progression routes; the top-right corner is not necessarily a universal winner.
Name quadrants by behavior, not praise:
- high carry / high pass progression;
- pass-led progression;
- carry-led progression;
- lower recorded progression activity.
Those labels tell the reader what is present without smuggling in a rating.
See the Thresholds in a Real Export
This FBPlot bubble scatter includes dashed vertical and horizontal reference lines. The axes combine selected creation measures and the subtitle records the under-21 population.
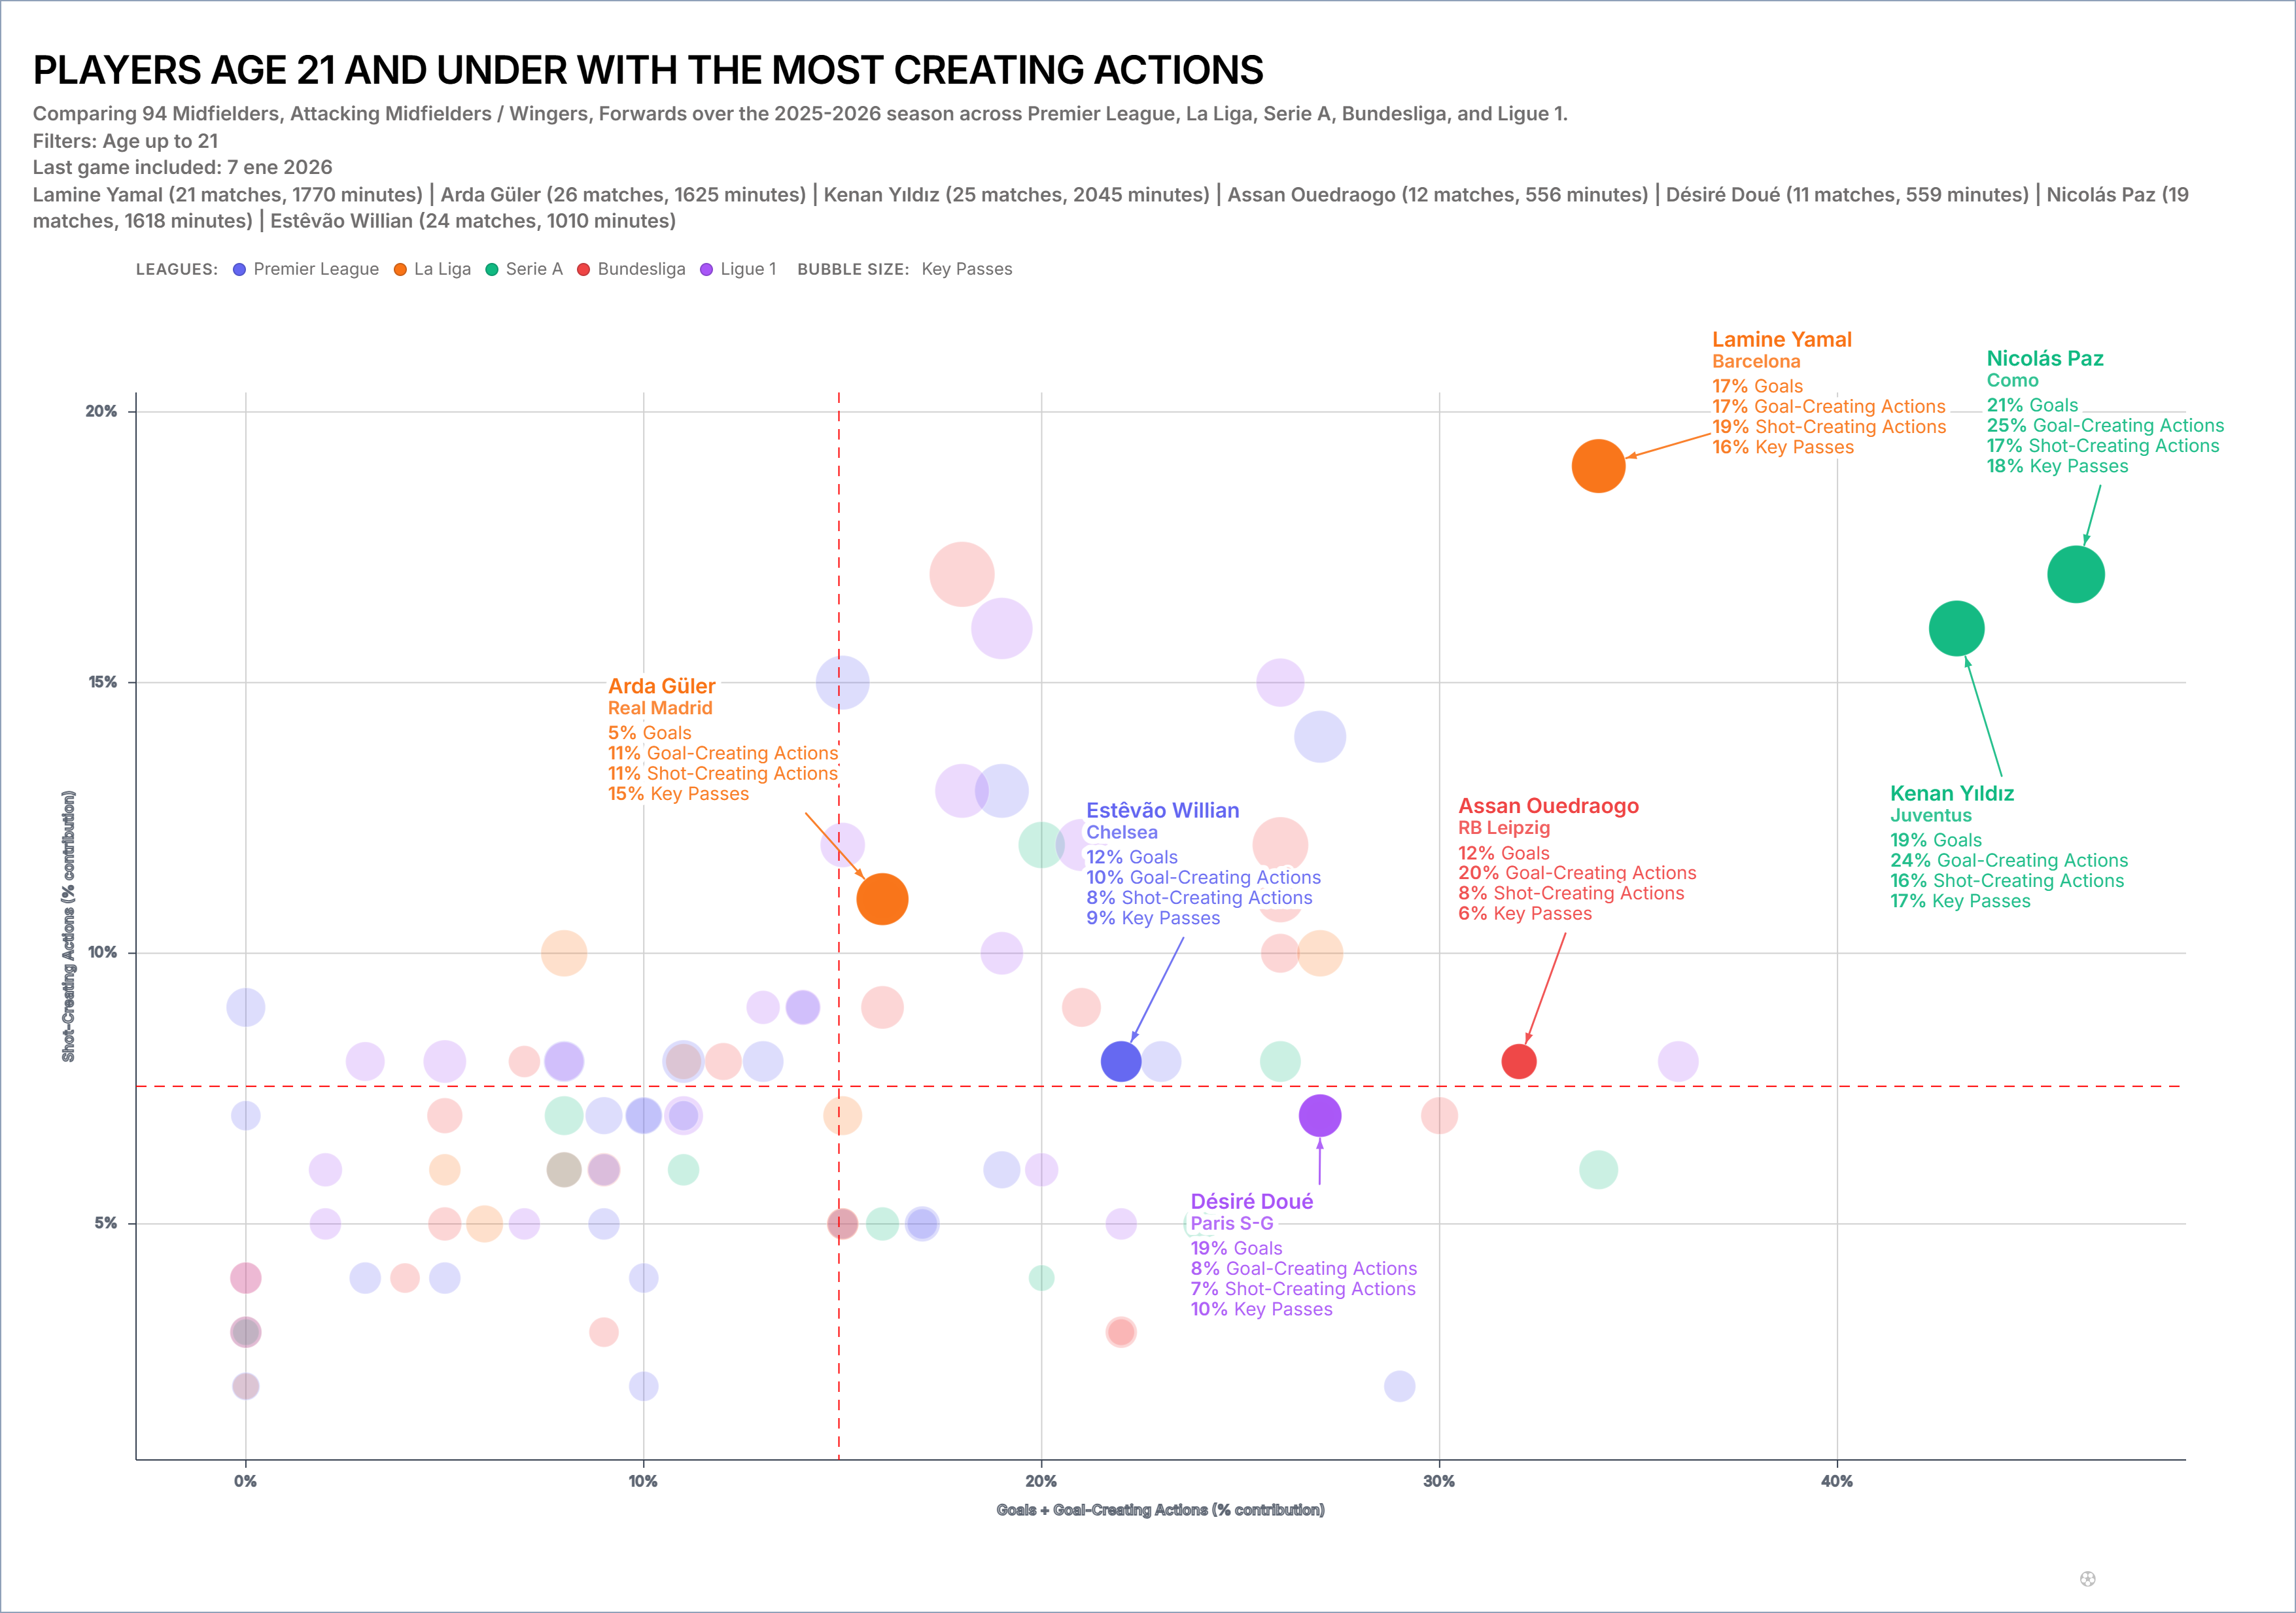
The figure also demonstrates why the caption must name the axis construction and bubble size. Without those definitions, quadrant labels sound more precise than the chart is.
Population Determines the Median
If the lines use population medians, every filter matters:
- league and season;
- position group;
- age range;
- minimum minutes or matches;
- total, per-90 or contribution mode.
Change from all midfielders to attacking midfielders and the median can move. Change the minutes threshold and low-sample extremes may disappear. Rebuild the interpretation after every population change.
Avoid Composite Axes Without a Method
Adding Goals and Goal-Creating Actions on one axis can be useful, but the axis now contains an implicit model. Are the metrics simply summed? Were they normalised first? Does one naturally have a larger scale?
Document every component and transformation. The composite-axis guide shows how to avoid a hidden weighting system.
If the combined axis cannot be explained in one sentence, use a single metric.
Quadrants Are for Navigation
Use the regions to direct attention:
- Which players combine both traits?
- Which specialists sit far into one side?
- Who lies close to a threshold and should not be categorised strongly?
- Which point is isolated from the rest of its role group?
Then inspect the values, sample and matches. The quadrant narrows the review; it does not complete it.
Treat Border Cases as Border Cases
A player 0.01 above the line and one 0.01 below are practically neighbours. Do not write them as opposite archetypes merely because the line falls between them.
Use distance from the threshold, uncertainty and the raw values. If the decision is sensitive to tiny movements, show labels or a table and avoid categorical language.
Use a Stable Benchmark for Tracking
If the chart will be updated weekly, a fresh median makes the lines move each time. That can be appropriate for a current-population snapshot but confusing for tracking.
Consider fixing a benchmark from a defined reference period. Label it clearly and refresh it according to a schedule rather than when the story benefits.
A Quadrant Caption That Works
Dashed lines show the medians of the eligible under-21 player population after the stated competition, position and minutes filters. Quadrant names describe metric combinations, not overall player quality.
That sentence removes most of the false certainty.
Build the base in the FBPlot scatter plot, then test the lines against one alternative population. If the shortlist changes dramatically, make population sensitivity part of the story rather than hiding it.
Found this helpful? Share it with your network
More Articles
How to Investigate Outliers in a Football Scatter Plot
An isolated football scatter point is a question, not an answer. Check sample, role, data quality and match context before calling it a scouting discovery.
Using Minutes as Bubble Size in a Football Scatter Plot
Bubble size can keep playing time visible in a football scatter plot, but it does not replace an exposure filter or make a small sample reliable.