
Build a football scouting shortlist from explicit filters, role evidence and reviewable charts instead of an unexplained ranking.
This workflow preserves the path from recruitment question to eligible population, visual review, shortlist and follow-up evidence.
A shortlist is useful only if another person can explain why every name entered it. A ranking copied from a chart is not yet a scouting process: it may hide the role, period, eligible leagues, minutes rule and metrics that produced the order.
A reproducible workflow preserves those decisions from the first question to the final handoff.
1. Write the Recruitment Question
Begin with the squad need, not a player name.
Identify midfielders in the selected competitions who can support progression and chance creation, meet the age and exposure criteria, and merit video or live review.
This is a screening question. It does not claim that public event data can decide recruitment.
2. Translate the Role
List the responsibilities that matter in the intended team context. Separate:
- essential responsibilities;
- useful secondary traits;
- constraints such as age, competition or availability;
- qualities that require video, physical, medical or character assessment.
The role-based metric guide helps translate responsibilities into evidence without treating popular metrics as universal.
3. Freeze the Eligibility Rules
Before inspecting results, record:
- period and cutoff;
- competitions;
- position group;
- age range if relevant;
- minimum minutes or matches;
- absolute or per-90 mode;
- exclusions.
Use the fair comparison contract to keep these rules consistent.
4. Use a Population View First
A scatter or swarm is useful for screening because it keeps the eligible population visible.
A scatter can show whether two role-relevant measures move together, reveal trade-offs and help identify unusual combinations. A swarm can show where a player sits in one or more distributions and whether an apparent rank represents a real gap or a dense cluster.
Do not label only famous players. Highlight the subjects selected by the stated rules and keep the rest of the population visible as context.
5. Create a Longlist Before a Shortlist
Treat the first visual selection as a longlist. For each candidate, record the reason for inclusion:
| Candidate record | What to preserve |
|---|---|
| Trigger | metric combination or distribution position that prompted review |
| Context | role, team and competition caveats |
| Sample | minutes, matches and period |
| Next evidence | video clips, role review, physical or contractual information |
| Status | keep, monitor, reject or insufficient evidence |
This prevents a chart highlight from becoming an unsupported recommendation.
6. Run Sensitivity Checks
Repeat the view after one reasonable change at a time:
- higher minutes threshold;
- separate competitions;
- narrower position group;
- totals instead of rates;
- one metric removed from a composite axis.
Names that disappear under every reasonable alternative may have depended on a fragile setup. Names that remain are not automatically better, but the screening signal is more robust.
The cross-league comparison guide is especially important before combining competitions.
7. Build Candidate Profiles
Once the population view has produced a longlist, use a radar or player bar to inspect individual metric profiles. Keep the same period, population and unit so the profile remains connected to the screening step.
Do not expand the metric set merely because the profile has space. Every axis should answer a role question.
8. Preserve the Decision Trail
For every edition of the shortlist, store:
- recruitment question;
- filter and metric configuration;
- chart type and unit;
- date and data cutoff;
- highlighted players;
- sensitivity checks;
- changes from the previous edition;
- named human reviewer.
The reproducibility manifest provides the minimum record, while the report-ready chart guide covers the final handoff.
From a Crowded Plot to Three Reviewable Cases
A shortlist usually begins with a crowded picture, not three obvious names. In this FBPlot scatter, 94 players aged 21 or under share the same 2025/26 Top 5 league population. The axes combine contribution measures, bubble size represents key-pass contribution, and only selected players are labelled. The unlabelled dots matter: they show the distribution that makes the highlighted cases unusual—or ordinary.
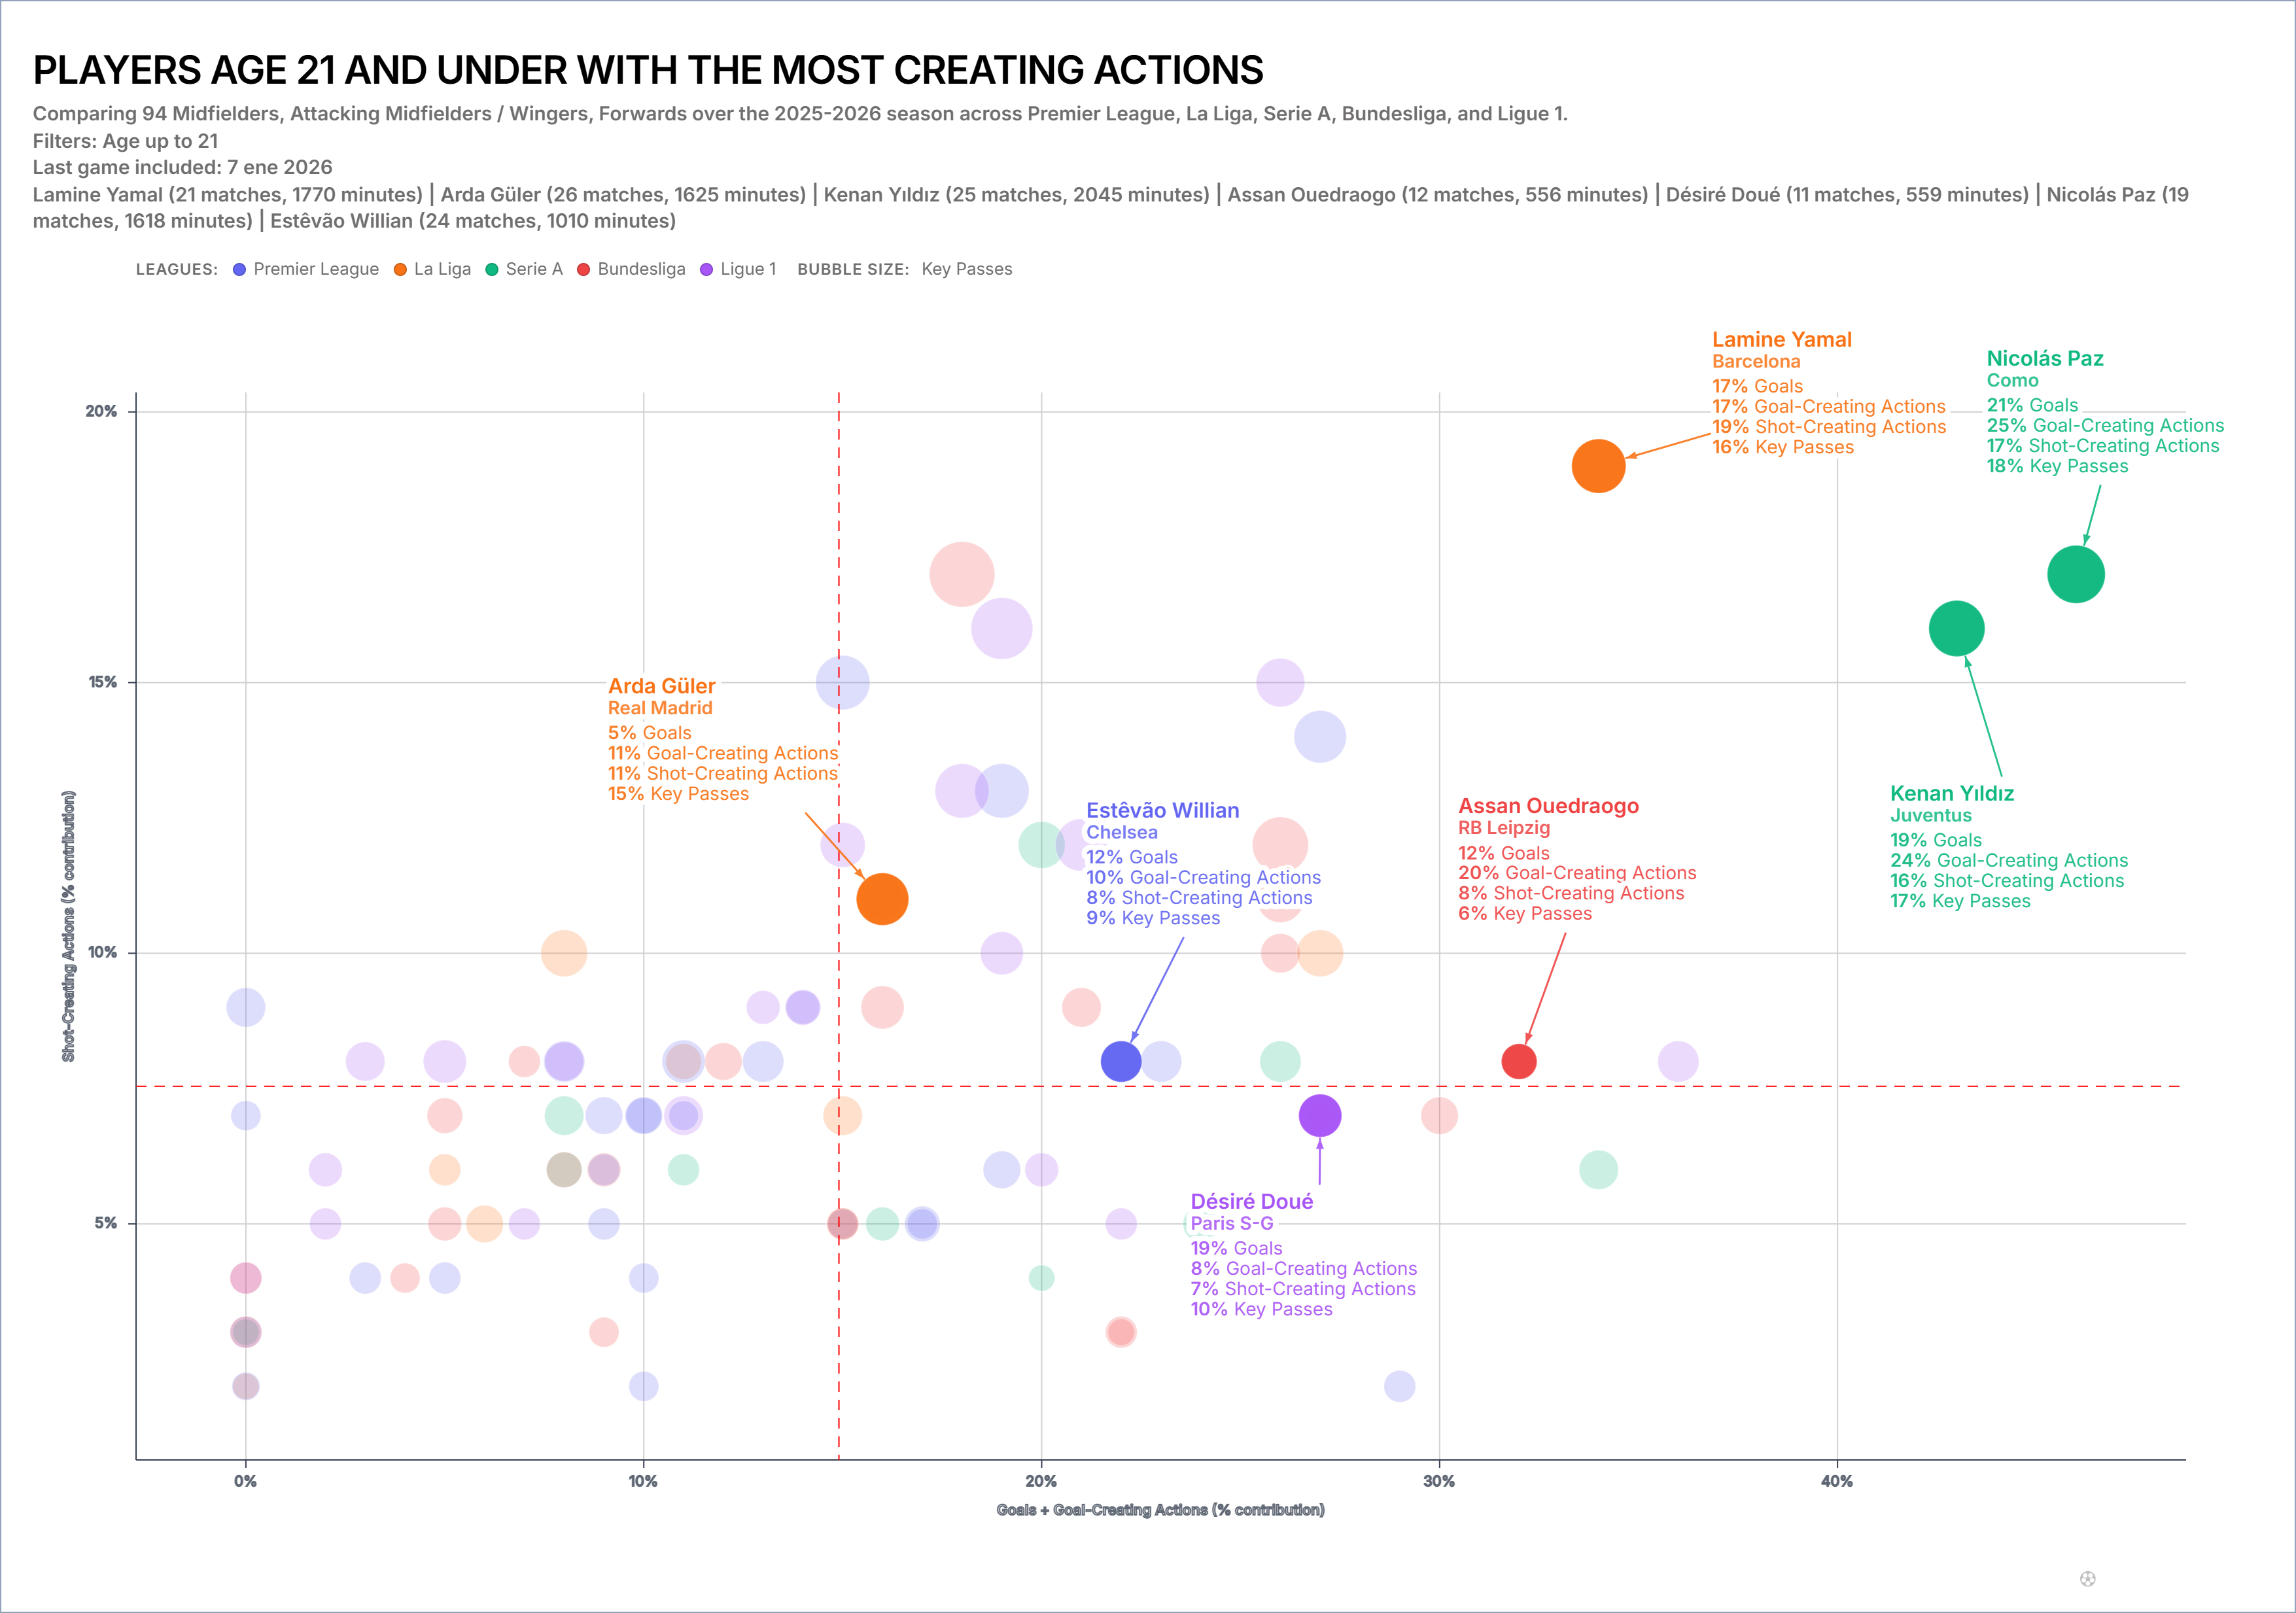
The plot is a starting point because each dot compresses a different playing history. One player may have built his position over 1,700 minutes; another may have fewer than 600. The reproducible workflow keeps both in the longlist while recording that difference. It does not promote the most visually isolated dot automatically.
Suppose three names move to the next stage. The analyst should be able to explain why each survived: one fits the target creative role, one remains interesting after a higher minutes threshold, and one offers a different balance between shooting and creation. Those reasons belong in the decision log alongside the configuration. If the role definition changes next week, the team can rerun the same population and see which names disappeared because the question changed—not because someone quietly edited the chart.
Build the First Longlist
Open the relevant FBPlot population creator, apply the frozen rules and highlight only candidates whose inclusion reason you can state in one sentence. Export the population view and its configuration together. The purpose is not to automate scouting judgement; it is to make the first screening step visible and reviewable.
Found this helpful? Share it with your network
More Articles
How to Document a Reproducible Football Chart
Record the minimum information another analyst needs to rebuild a football chart: question, source, period, population, metrics, units and configuration.
Small Samples in Football Analytics: Minutes, Matches and Uncertainty
Handle early-season and low-minute football data with explicit exposure rules, sensitivity checks and cautious language.