
Translate one scouting observation into a chart whose population, metrics, claim and caption support a specific report decision.
A report chart should not display every available statistic. It should preserve the evidence chain from finding to context, limitation and next action.
A report-ready chart supports one scouting statement and makes its conditions visible. It is not a gallery of every metric available for the player.
The work begins by separating the observed finding from the recruitment interpretation.
Write the Finding
Use descriptive language:
In the selected period and eligible midfield population, the player combines high recorded values on the two progression measures shown.
Avoid:
The player will solve our build-up problems.
The second sentence is a projection that requires tactical, video, physical and contextual evidence beyond the chart.
Define the Decision Context
Record:
- intended role;
- competition and team context;
- period and cutoff;
- comparison population;
- minutes or matches rule;
- metric definitions and units;
- reason the finding matters.
Use the fair player comparison contract before choosing the visual.
Choose One Chart Task
Use:
- a scatter for a relationship across the population;
- a swarm for a distribution and highlighted subject;
- a radar for a compact multidimensional profile;
- a player bar for readable metric rows and values.
If the report needs two tasks, use two clearly connected figures rather than forcing every concept into one.
Keep the Population Visible
A scouting report often focuses on one player, but relative claims require a reference group.
Show or state:
- who was eligible;
- why that group is relevant;
- whether ranks are within one league or pooled;
- whether the player was highlighted before or after inspection.
The shortlist workflow explains how the subject should emerge from a reviewable screening process.
Select Supporting Metrics
Add only metrics that clarify the same role hypothesis. The role-based metric method helps avoid a generic “complete profile.”
For every metric, ask:
- What responsibility does it represent?
- Is the unit suitable?
- Does it duplicate another field?
- What contextual factor could explain it?
- What evidence is still missing?
Write the Caption as Evidence
A report caption should contain:
Finding:
Period and cutoff:
Population:
Eligibility:
Metrics and units:
Comparison scope:
Important limitation:
Next evidence required:
This turns the chart from decoration into an auditable report component.
Select the Output Format
Landscape may suit a report page or presentation, while portrait or square can work in a compact player card. Choose from the current FBPlot aspect-ratio presets and test the exported file inside the actual report layout.
See the aspect-ratio guide.
Run a Challenge Review
Ask another reviewer to challenge:
- the population;
- the role hypothesis;
- the exposure rule;
- the metric selection;
- the conclusion language;
- alternative explanations;
- missing evidence.
Record whether the chart was retained, revised or rejected.
Preserve Reproducibility
Attach the minimal configuration record from the reproducible chart guide. A future report should be able to refresh the same question without reverse-engineering the image.
Turn a Vague Impression Into a Testable Sentence
Suppose the scouting note says, “Wesley Fofana is active and secure in possession.” That sentence is too broad for one chart. The FBPlot profile below can test narrower parts of it—passing volume, carries, interceptions and duel success—while leaving tactical security and decision quality for match review.
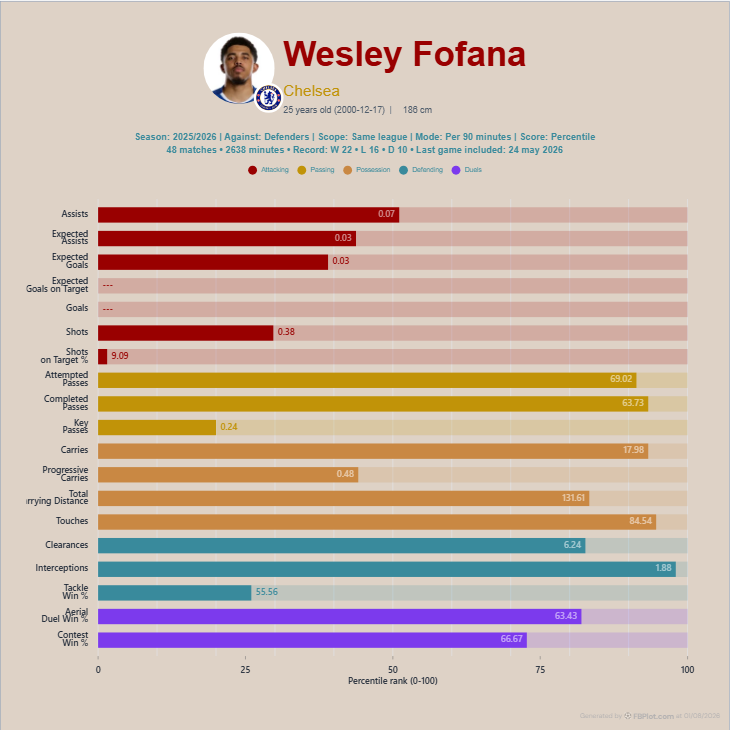
A report-ready finding might become: “In FBPlot's 2025/26 seasonal view, Fofana's per-90 profile against same-league defenders combines passing involvement with selected defensive and duel indicators.” It is less cinematic than “dominant ball-playing defender,” but every part of the sentence maps to visible evidence.
The remaining work is where scouting earns its value. Review whether the passing occurs under pressure, whether interceptions come from proactive positioning or a deep team block, and whether unavailable attacking rows are simply irrelevant to the role. The chart narrows the question and makes the statistical context portable. It should never be used to skip the football explanation.
Before the figure enters the report, assign someone to challenge it. Their job is to offer a plausible alternative explanation for the same bars: possession dominance, game state, team territory, set-piece role or sample selection. The analyst does not need to disprove every possibility, but the final wording should acknowledge the ones that materially change the recruitment decision.
That challenge often improves the caption. “High interception percentile” becomes “high interception percentile in this same-league defender population, to be checked against the team's territorial approach.” The second version is longer by a few words and far more useful to the person deciding what to watch next.
Build the Report Figure
Open the FBPlot chart type that matches the finding, apply the original shortlist population and select only the evidence needed for the claim. Export in the report’s destination ratio and place the factual caption beside it. The chart should make the decision trail clearer, not make the decision by itself.
Found this helpful? Share it with your network
More Articles
How to Document a Reproducible Football Chart
Record the minimum information another analyst needs to rebuild a football chart: question, source, period, population, metrics, units and configuration.
Small Samples in Football Analytics: Minutes, Matches and Uncertainty
Handle early-season and low-minute football data with explicit exposure rules, sensitivity checks and cautious language.