
Radar and spider usually name the same radial family; pizza changes the visual treatment. The analytical meaning still comes from axes, scales and population.
Understand football radar, spider and pizza chart terminology, then focus on the decisions that truly change interpretation: metrics, units, period and peers.
Search for a “football spider chart” and you will often find what another analyst calls a radar. Search for a pizza and the same family appears with coloured wedges instead of one connected polygon.
The vocabulary is inconsistent. The underlying analytical questions are more stable.
In practice, radar and spider usually refer to a set of radial axes connected into a polygon. Pizza chart commonly refers to a circular profile divided into wedges, often with each wedge filled to represent a value. Product implementations vary, so the name alone does not guarantee a particular scale or method.
Radar and Spider: Usually the Same Reading Task
A radar places one metric on each axis radiating from the centre. Values farther from the centre usually represent a larger score under the chosen scale. Connecting the points produces the familiar web or polygon.
“Spider” is often a visual nickname for the same construction. Calling it a FIFA spider chart, player radar or football radar does not change the data.
What changes the meaning is:
- which metrics occupy the axes;
- whether they show raw values, rates or percentiles;
- the axis direction and range;
- period and competition scope;
- the eligible comparison population.
Those fields belong in the chart or caption regardless of the name used in search.
Pizza: A Different Visual Treatment
A pizza chart replaces the connected polygon with wedges. Each metric gets a slice, and the fill length or area communicates the plotted score. Categories can be grouped by colour, which helps the reader scan possession, passing, attacking and defensive themes.
Here is a real FBPlot pizza:

The pizza can make categories and printed values easier to separate. It does not create a universal player rating. A larger filled area still depends on axis selection and ordering.
Compare With a Radar
The FBPlot radar below encodes a profile through a connected outline:
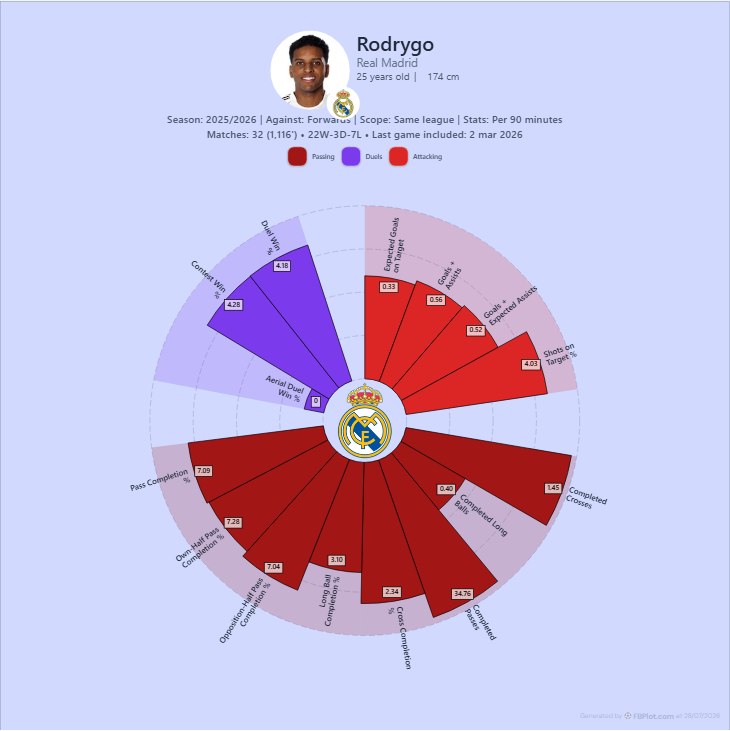
These images should not be compared numerically: they use different players and configurations. They demonstrate two ways to present a radial profile.
The Name Does Not Tell You the Scale
A radar can plot raw counts, per-90 rates, percentages or percentile ranks. A pizza can do the same. Never assume the outer ring means the maximum observed value, the 100th percentile or a fixed football target without reading the legend.
The guide to percentile versus raw-value radars explains how those scales answer different questions.
Shape Is Powerful—and Easy to Overread
Radial charts make pattern recognition fast. They also invite the eye to compare area, even when area has no defined analytical meaning. Reordering identical axes changes the polygon; adding correlated metrics can make one phase dominate the shape.
Read the chart in this order:
- context line;
- metric labels;
- observed values and scale;
- clusters of related axes;
- one alternative population or unit.
Only then describe the shape.
Which One Should You Use?
Choose a connected radar when overlapping a small number of profiles or emphasising the outline helps the comparison. Choose a pizza when one profile, category grouping and printed values are the main reading tasks.
Choose neither when exact row-by-row lookup matters. A player bar chart shares a common baseline and is often easier to audit.
Terminology for Titles and Captions
Use the term your audience recognises, then define the implementation once:
This football radar (also called a spider chart) plots per-90 percentile scores for the selected metrics against same-league forwards.
For a pizza:
This pizza chart uses radial wedges to show the same type of multi-metric player profile; it is not an overall score.
That wording can satisfy the reader searching with different names without pretending the names create different evidence.
Build the Question, Then Pick the Shape
Open the FBPlot Player Pizza Chart or Player Comparison. Keep the metric set and comparison contract fixed, preview both geometries, and choose the one whose reading task matches the destination.
If changing the visual changes the conclusion, return to the values. The football evidence should survive the chart's nickname.
Found this helpful? Share it with your network
More Articles
How to Investigate Outliers in a Football Scatter Plot
An isolated football scatter point is a question, not an answer. Check sample, role, data quality and match context before calling it a scouting discovery.
Football Scatter Plot Quadrants Without Arbitrary Winners
Quadrant lines organise a football scatter plot, but the threshold and axis direction determine whether “top right” has any useful meaning.