
Raw values show what the player recorded; percentiles show where that value sits among selected peers. A strong football profile often needs both layers.
Choose between raw-value and percentile football radars, document the comparison population, and avoid treating relative rank as the observed performance.
The player recorded 2.4 progressive carries per 90. The chart shows an 82nd-percentile axis. Those numbers describe the same metric, but they answer different questions.
The raw or normalised value tells us what the player recorded. The percentile tells us where that value sits inside one eligible population. Confusing the two is one of the most common mistakes in football radar interpretation.
Raw Values Preserve Football Units
A raw value can be a total, a per-90 rate or a percentage. Its unit keeps the observation connected to the event:
- 12 goals during the period;
- 2.4 progressive carries per 90;
- 61% aerial duels won.
The number can be compared directly only when definitions, period and units align. It does not tell the reader whether 2.4 is common or unusual among similar players.
Percentiles Add Population Context
A percentile orders the eligible observations and describes relative position. An 82nd percentile means the value ranks above roughly 82% of that defined group under the implementation used.
Change the group and the rank can change. Same-league forwards, Top 5 league forwards and all available forwards are different populations. Position, minutes threshold and season matter too.
The percentile is not a percentage of maximum performance and not a probability that the player is good.
One FBPlot Radar Carries Both Layers
In the captured FBPlot radar below, the comparison population determines the relative radial score while printed labels retain the selected observed values.
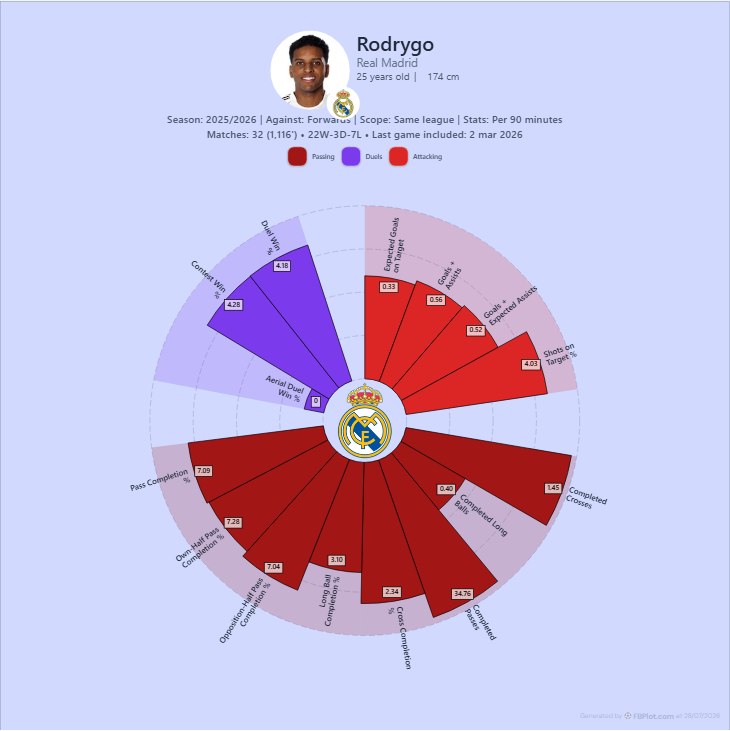
This dual presentation supports a disciplined sentence: “The player recorded X per 90, which placed him at Y relative to the selected peers.” If either number is missing, part of the statement becomes harder to audit.
Why the Percentile Can Move
FBPlot's paired population captures keep player, season, role, metrics and per-90 mode fixed. Only the scope changes from same league to Top 5 leagues.
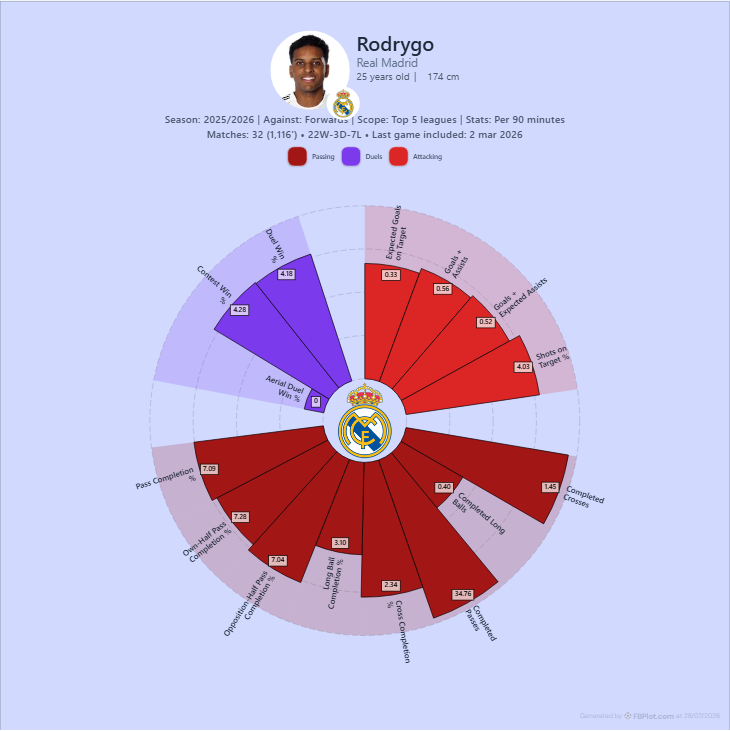
This is why a percentile without its population is incomplete.
When Raw Values Should Lead
Lead with observed values when:
- the report needs exact event frequency or season output;
- the audience understands the unit;
- the comparison involves only a few aligned players;
- the population would add more ambiguity than clarity;
- a decision threshold uses an actual count or rate.
A bar chart is often effective because values share a baseline and can be read row by row.
When Percentiles Help
Use percentiles when:
- the reader needs fast relative context;
- metrics have very different natural scales;
- the eligible population is coherent and disclosed;
- the profile contains several dimensions;
- the chart is a screening tool rather than the final decision.
Percentiles compress scale differences, but that convenience can hide how far apart two observations really are. The 80th and 90th percentiles may represent a small or large raw-value gap depending on the distribution.
Do Not Mix Populations Across Axes
A profile becomes difficult to interpret if one axis uses same-league forwards, another uses all midfielders and a third uses a custom age group without disclosure.
Use one coherent population for the main chart. If a special metric needs another comparison set, place it in a separate panel and label the change.
Percentiles Do Not Fix Bad Metric Selection
Converting every axis to a common 0–100 scale makes a polygon look balanced. It does not make duplicated or irrelevant metrics independent.
Goals, Goals + Assists and Goals + Expected Assists can reward overlapping attacking evidence. A role profile should still use a compact set tied to a question. The guide to how many radar metrics provides an axis audit.
A Two-Sentence Caption
Use this pattern:
Observed values are shown per 90 for the 2025/26 period. Radial lengths represent the player's percentile among eligible same-league forwards under the displayed minutes rule.
The first sentence defines the value. The second defines the relative score.
For a broader explanation, read football percentiles explained. Then use FBPlot Player Comparison to test one player against two scopes without changing any other input.
Found this helpful? Share it with your network
More Articles
How to Investigate Outliers in a Football Scatter Plot
An isolated football scatter point is a question, not an answer. Check sample, role, data quality and match context before calling it a scouting discovery.
Football Scatter Plot Quadrants Without Arbitrary Winners
Quadrant lines organise a football scatter plot, but the threshold and axis direction determine whether “top right” has any useful meaning.