
A third player can provide a benchmark or expose a false binary, but it can also turn a readable radar into overlapping shapes and labels.
Decide whether a football player comparison needs two or three profiles, pick a meaningful reference player and change chart type when precision matters.
The third player usually enters the analysis with good intentions: “Let's add a benchmark.” Five minutes later, the radar has three translucent shapes, eight axes and a legend that sends the reader hunting for colours.
A third profile can improve a decision. It should earn its place by changing the question.
Two Players Create a Direct Contrast
A two-player comparison is easiest to explain when the decision is genuinely binary: current starter versus transfer target, two shortlist finalists, or the same player in two seasons.
The reader can track two colours, and the writer can describe trade-offs metric by metric. If the profiles overlap heavily, switch to a bar or table for precision rather than adding decorative separation.
Two players are usually enough when the report needs a clear recommendation between defined alternatives.
The Third Player Needs a Job
A useful third profile usually serves one of three purposes:
- Benchmark: an established player represents the target role.
- Internal reference: a current squad member shows how the candidates relate to the existing team.
- Alternative archetype: a different solution exposes that the shortlist is not a simple binary.
“A famous player” is not a job. The benchmark should share a defensible role, period and population, and the report should explain why that reference helps the decision.
Beware the Aspirational Benchmark
Using an elite player as the third profile can make every candidate look inadequate without improving the recruitment decision. The benchmark may operate in a stronger team, a different league or a role built around unusual strengths.
If the club cannot reproduce the environment, the reference becomes decoration. Consider a realistic internal player or a league peer instead.
The cross-league comparison guide explains how competition context affects the claim.
If the shortlist also mixes roles, resolve that before adding a benchmark. The guide to comparing players in different positions separates a small shared-task panel from the role-specific evidence.
Radar Readability Has a Limit
Radar overlays are useful for broad profile shape. With three players, several problems arrive quickly:
- crossings multiply;
- similar colours become hard to distinguish;
- filled areas hide one another;
- exact values are harder to trace;
- mobile labels compete for space.
Use outlines instead of heavy fills, choose high-contrast colours and keep the axis count compact. If the conclusion depends on small differences, use a row-based chart.
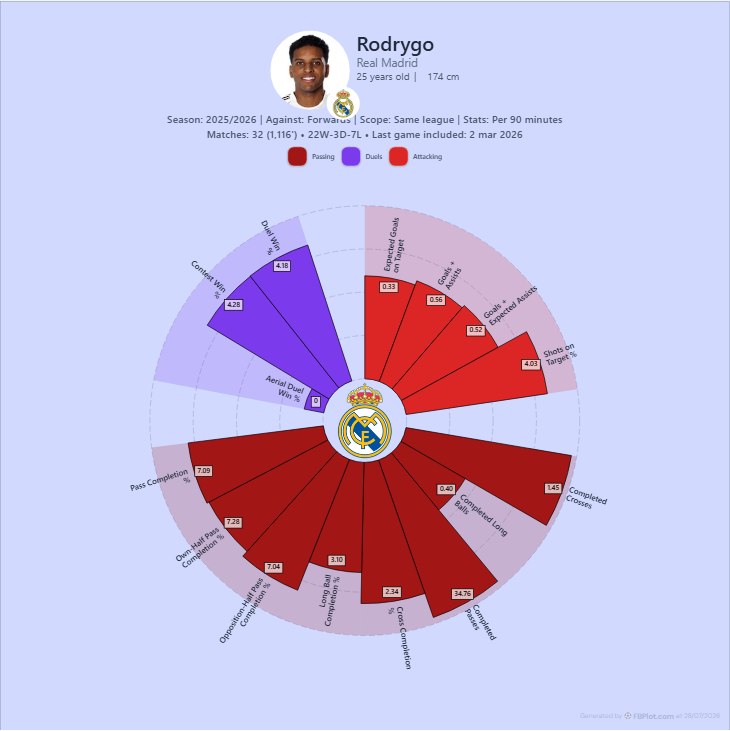
The FBPlot radar below contains one profile, which makes its labels and context easy to inspect. Imagine three overlapping polygons before deciding that a third profile belongs in the same geometry.
A Third Player Can Expose a False Binary
Suppose Candidate A offers ball progression and Candidate B offers final-third output. The debate becomes “control or threat”. An internal player who provides some of both may reveal that the real requirement is balance, not choosing one extreme.
That is a valuable use of the third profile: it changes the decision frame. The report should say so explicitly.
Keep the Contract Identical
For all profiles, lock:
- period and competitions;
- role and position group;
- minimum exposure;
- total, per-90, percentage or contribution mode;
- metric IDs and order;
- comparison population;
- data cutoff.
Do not let the benchmark use a different season simply because it creates a stronger shape. If a difference is unavoidable, label it rather than hiding it.
When a Bar Chart Wins
Use a bar chart or table when the reader needs to answer “who has the higher value on this row?” Bars share a baseline, and three players can be grouped without tracing polygons around a circle.
Use a radar when the reader needs a compact profile pattern and the differences are large enough to survive the geometry. The focused guide to radar versus bar charts provides the full decision.
The One-Sentence Test
Before adding the third profile, complete this sentence:
Player C is included because...
If the answer is “for context”, keep writing until the context is specific. If it is “because the tool allows three”, remove the profile.
A Clean Report Structure
Start with the two candidates. Introduce the third player only in the section where the benchmark matters. If the visual becomes crowded, give the benchmark a separate panel or show its target range as an annotation rather than another full shape.
FBPlot's current comparison workflow supports two or three player-season profiles. Use FBPlot Player Comparison to build both versions, then preview them at the actual report or mobile size. Choose the version that makes the decision easier to explain aloud.
Found this helpful? Share it with your network
More Articles
How to Compare the Same Football Player Across Seasons
A season-to-season player comparison needs aligned roles, competitions, minutes, units and data cutoffs before a changed chart can support a changed-player claim.
How to Compare Second-Division and Top-Flight Football Players
Cross-level player comparison needs role, opportunity, population and match context. There is no honest universal coefficient for translating a statistic upward.