
Radar charts reveal multi-metric profile shape; bar charts make individual values easier to compare. Choose from the reader's task, not visual preference.
Compare football radar and player bar charts through pattern recognition, value lookup, multiple profiles, mobile readability and publication context.
The same player profile can feel completely different when arranged around a circle or stacked as rows. The data may be unchanged; the reading task is not.
A radar asks the reader to scan a shape across several axes. A player bar chart asks the reader to move down a shared list and inspect each metric. Neither is the “professional” choice by default. The better chart is the one that makes the intended comparison easier and the unintended inference harder.
If the vocabulary itself is unclear, start with radar, spider and pizza chart terminology. The name does not determine the scale or comparison method.
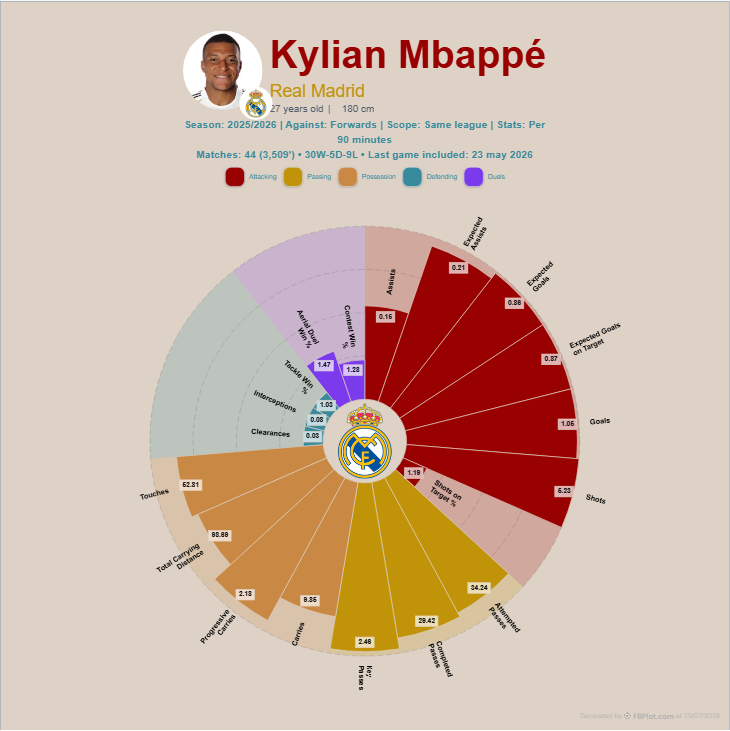
Radar Is for Pattern
Use a radar when the main sentence is:
I want the reader to see the broad shape of this multi-metric profile.
Related axes can form visible clusters. A creator can compare two carefully chosen players or show where one role profile is unusually broad or narrow.
The cost is precision. Axes point in different directions, the polygon attracts attention, and readers may compare area even though area is not an FBPlot overall score.
Bar Is for Lookup
Use a bar when the main sentence is:
I want the reader to inspect the observed value and relative result for each metric.
Rows share a baseline and stay separate. That supports audit, annotation and written references such as “see the third row”. A bar is usually easier when the conclusion depends on a few exact differences.
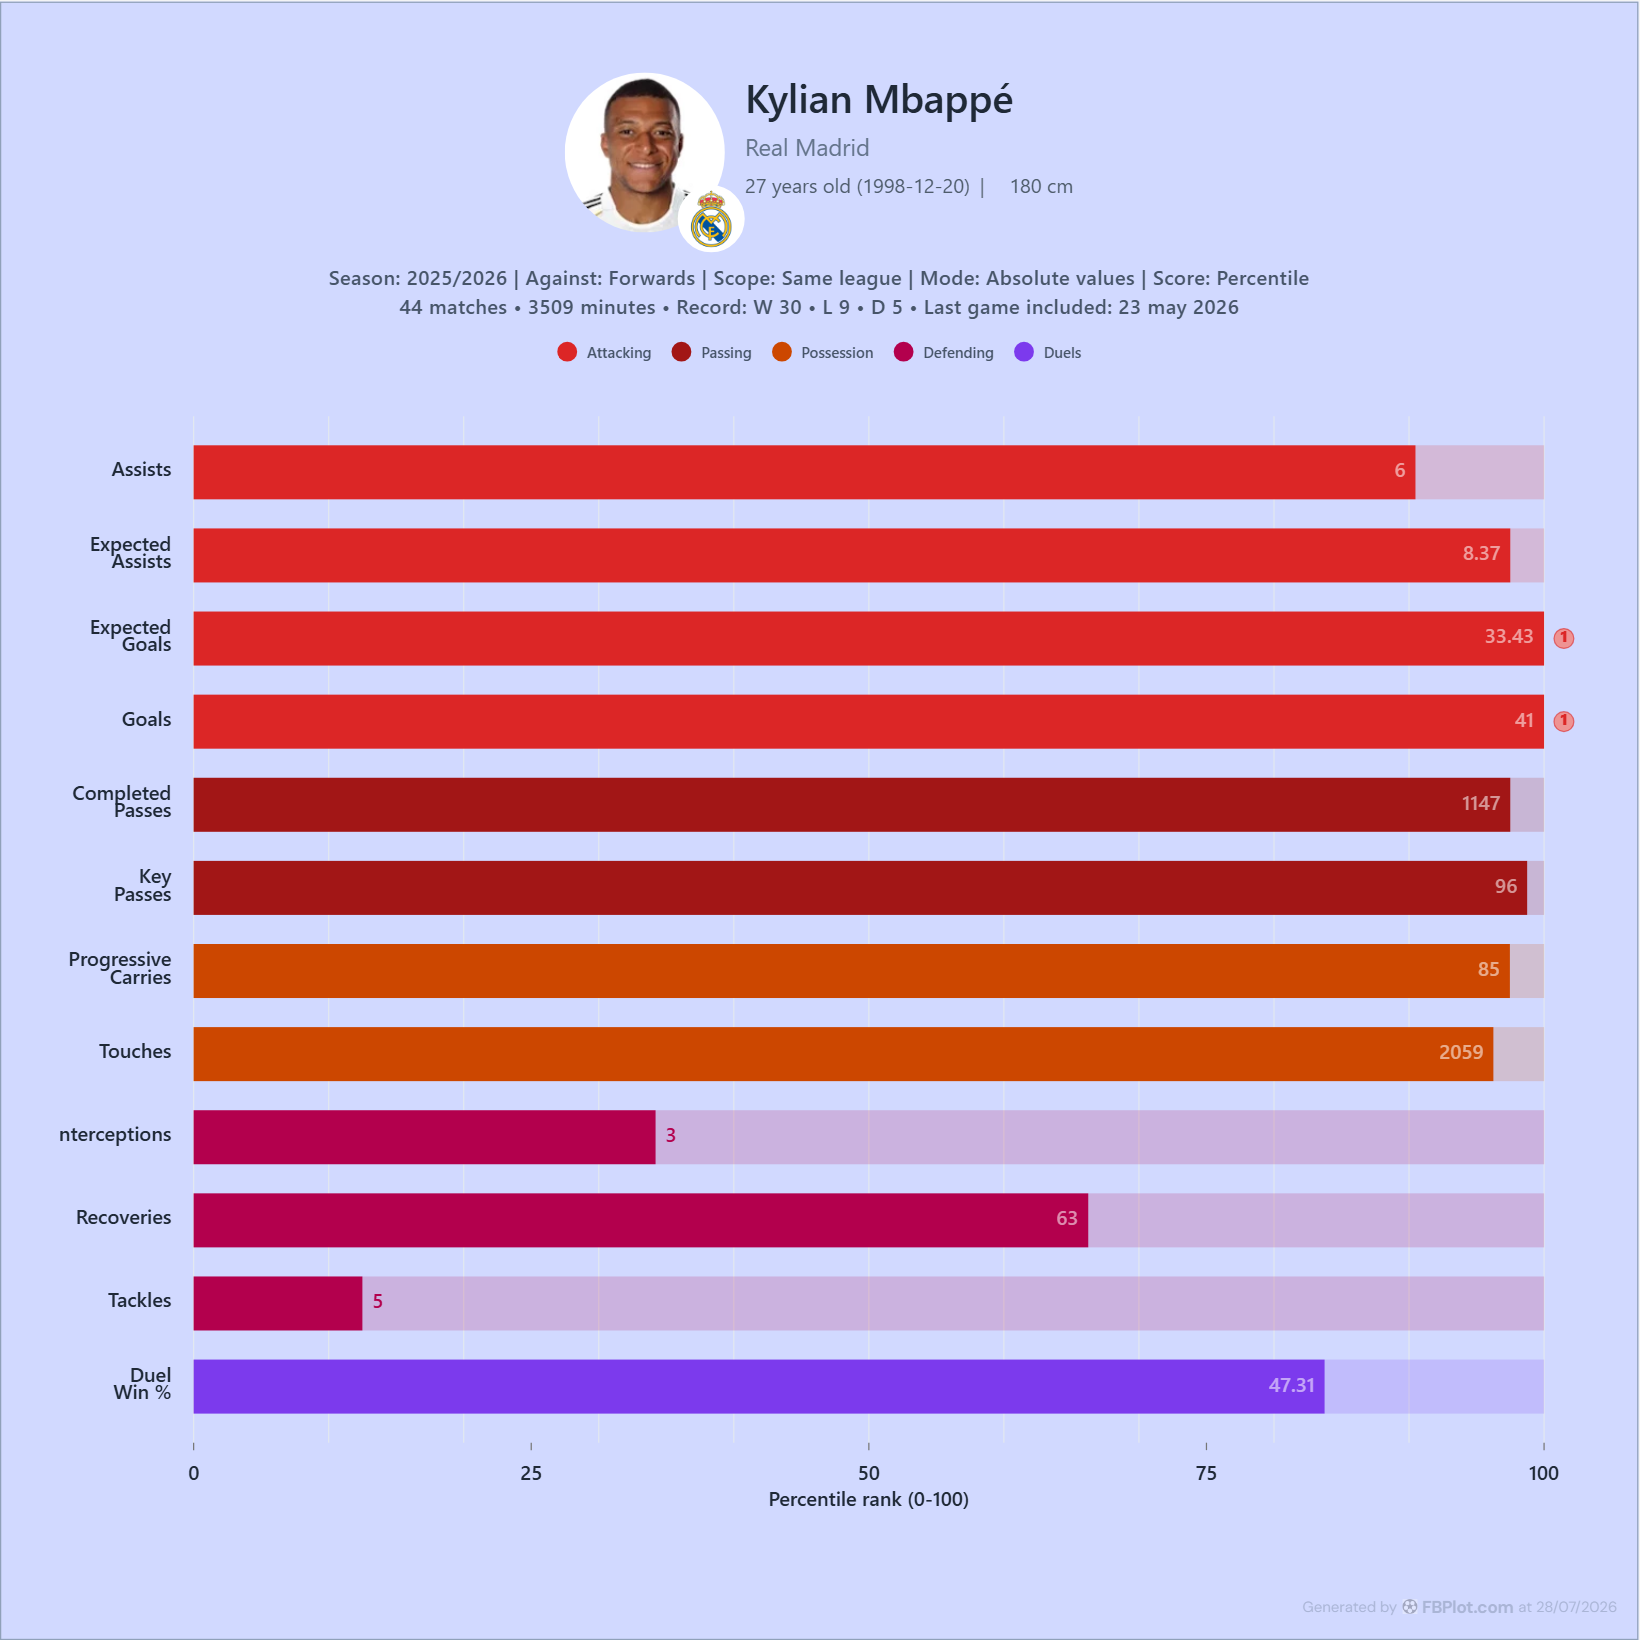
The two examples demonstrate geometry, not a controlled head-to-head dataset.
Choose by Reader Question
| Reader needs to see | Better starting point | Why |
|---|---|---|
| overall role pattern | radar | shape and clusters are visible quickly |
| exact metric rows | bar | shared baseline and direct labels |
| two broad profiles | radar or grouped bar | depends on difference size and axis count |
| three precise profiles | bar | overlapping polygons become difficult |
| one compact social graphic | radar/pizza | radial composition uses a square or portrait well |
| an auditable scouting report | bar | rows support written references and notes |
This table is a starting point. Preview the chart at its real destination size.
Axis Count Changes the Decision
A six-axis radar can be readable. A 19-axis radar asks more from the reader. A long bar chart can also fail if it becomes a scrolling inventory.
Select the smallest metric set that supports the claim. If the report needs a broad profile and precise lookup, use a radar as the summary and a short bar panel for the decisive rows.
The second chart should add precision, not repeat the first for decoration.
Multiple Players Change the Geometry
Two radar outlines can expose trade-offs. Three can become a tangle. Grouped bars scale better for exact multi-player comparison, but colour and label density still need care.
The guide to two-player versus three-player comparisons explains when a benchmark genuinely improves the decision.
Mobile Is a Different Test
On a phone, radial labels shrink or wrap around the edge. Long bar labels can also crowd the value area, but rows can stack more naturally.
Export the intended aspect ratio and view it at approximately the final display width. The mobile label guide gives a practical legibility check.
Both Charts Need the Same Context
Geometry does not remove the need for:
- period and competition scope;
- role and comparison population;
- total, per-90, percentage or contribution mode;
- minutes or eligibility threshold;
- data cutoff and metric definitions.
If the radar and bar use different settings, they are answering different questions even when the title is the same.
A Simple Production Workflow
- Write the claim in one sentence.
- Build a compact bar view and identify the decisive rows.
- Build a radar only if the broader pattern adds something.
- Preview both at destination size.
- Ask a second reader to retrieve the evidence behind the sentence.
Choose the chart that produces the correct answer with less explanation.
Start with the FBPlot Player Bar Chart for audit or Player Comparison for a radial profile. The best result may be one chart—or a summary and evidence pair whose jobs do not overlap.
Found this helpful? Share it with your network
More Articles
How to Investigate Outliers in a Football Scatter Plot
An isolated football scatter point is a question, not an answer. Check sample, role, data quality and match context before calling it a scouting discovery.
Football Scatter Plot Quadrants Without Arbitrary Winners
Quadrant lines organise a football scatter plot, but the threshold and axis direction determine whether “top right” has any useful meaning.