
Choose an expected-goals chart from the question: accumulated xG, xG per 90, shot context or a relationship with another metric.
The same xG field can support different descriptive views. This guide separates those questions and keeps minutes, shots, role and population visible.
Expected Goals is a current FBPlot metric label. Its exact provider definition belongs in the live Metrics Glossary; this article focuses on choosing a chart and context, not redefining the model.
The first decision is whether the question concerns accumulated output, playing-time-normalised rate or a relationship with another measure.
Totals: Contribution Across the Period
An xG total answers:
How much expected-goal value was accumulated during the selected period?
Totals retain availability and playing time as part of the result. They are useful for season contribution, but players with unequal minutes have unequal exposure.
A responsible total chart shows:
- exact period and cutoff;
- competition scope;
- eligible population;
- minutes or matches;
- whether penalties or other components require clarification in the current definition.
Per 90: Rate Conditional on Minutes
xG per 90 answers:
At what recorded rate did the player accumulate xG while on the pitch?
It does not answer how much the player contributed over the entire season, and it does not remove small-sample risk.
Use the per-90 methodology, apply a task-specific exposure rule and retain minutes beside the rate.
xG and Shot Volume
A relationship view can ask whether higher xG comes through more shots, different shot quality or both. The precise analysis depends on the current available metrics and definitions.
Do not infer shot quality from xG alone without inspecting the relevant denominator or shot context. A scatter can reveal patterns, but it does not establish why they exist.
Choose the Chart
Bar
Use a bar for an explicit one-metric ranking with a disclosed population and eligibility rule. Follow the responsible ranking audit.
Player Bar
Use a player bar when xG must appear beside complementary metric rows and their observed values.
Scatter
Use a scatter when the question concerns xG’s relationship with another same-grain measure. Keep one concept per axis before considering a composite. The composite-axis guide explains the additional requirements.
Swarm
Use a swarm to inspect the xG distribution, density and selected outliers inside one coherent population.
Control Role and Opportunity
xG opportunities depend on:
- position and role;
- team possession and territory;
- set-piece or penalty responsibility;
- opponent and game state;
- minutes;
- period.
Per-90 normalisation addresses only playing time. It does not equalise these other conditions.
Avoid Finishing Verdicts From One Field
Comparing goals with xG can prompt useful questions about observed finishing outcomes, but short periods can produce volatile differences. A descriptive gap is not automatically a stable finishing skill estimate.
State the sample and avoid projecting a past rate as a guaranteed future result.
Run Three Views
For one stable population:
- chart xG totals;
- chart xG per 90 with an explicit minutes rule;
- chart xG against one justified related metric.
Keep period, population and cutoff fixed. Record which observations persist and which depend on the encoding.
The small-sample guide provides a sensitivity check.
Publish the Context
Your caption should state:
- current metric definition link;
- unit;
- period and cutoff;
- competition and role population;
- exposure rule;
- selected related metric;
- important exclusions.
The xG Row Is More Useful Beside Its Neighbours
Erling Haaland's absolute-value pizza places expected goals beside goals, expected goals on target, shots on target and chance-creation metrics. That radial scan discourages a common shortcut: reading xG as a self-contained verdict. The neighbouring slices show that chance volume, shot outcome and playing time belong to the same conversation.
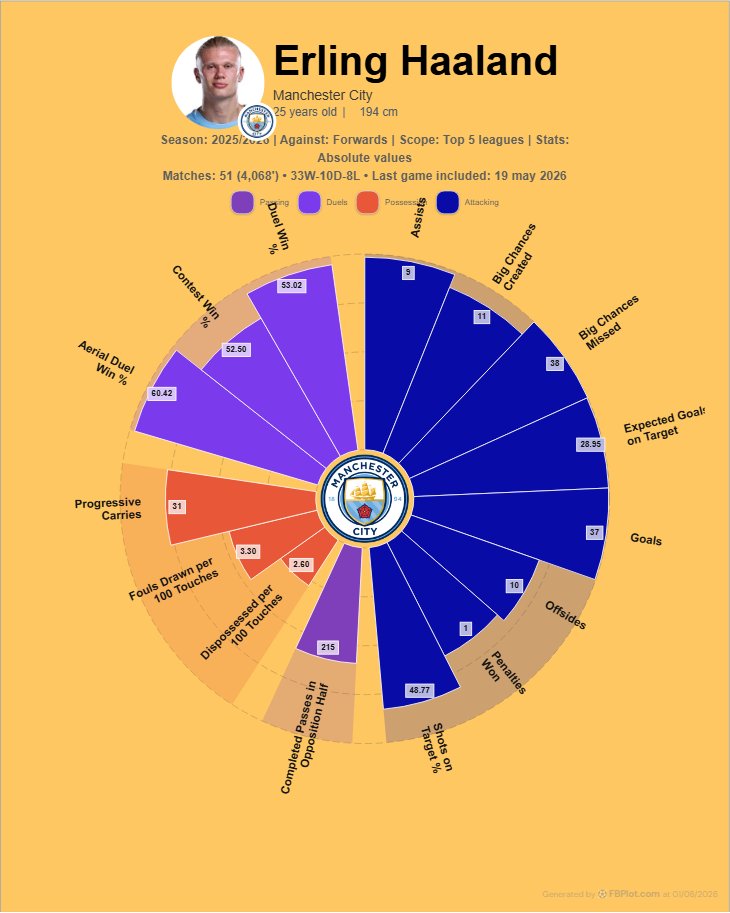
Suppose goals sit above expected goals in a completed period. The graphic can establish that the recorded outcomes exceeded the model total in this sample. It cannot decide whether the gap is a stable finishing skill, a sequence of unusual chances or ordinary variation. That stronger claim needs more seasons, shot context and a clear statement about the model behind xG.
Now switch to per 90. The question changes from accumulated season contribution to chance frequency conditional on minutes. A player with fewer minutes may rise relative to peers even though his total opportunity remains lower. The responsible article shows both views when availability matters and explains why the ordering changed instead of presenting the more dramatic version alone.
Role changes the baseline too. A midfielder's expected-goals total is generated from a different pattern of opportunities than a striker's: later arrivals, set pieces, long shots or a smaller share of penalty-area possessions may dominate. Comparing both in one undifferentiated population can turn role into apparent finishing quality. Start with a sensible peer group, then widen it only when the broader question is explicit.
Finally, keep the model modest. xG estimates chance quality from recorded features; it does not know every defensive cue, player intention or tactical instruction. The best xG chart opens a discussion about chance selection and process. It does not close the evaluation with one decimal.
Build the xG View
Start at the glossary, decide whether the article concerns volume, rate or relationship, and open the corresponding FBPlot chart creator. Do not publish until the title, unit and population answer the same question.
Found this helpful? Share it with your network
More Articles
How to Document a Reproducible Football Chart
Record the minimum information another analyst needs to rebuild a football chart: question, source, period, population, metrics, units and configuration.
Small Samples in Football Analytics: Minutes, Matches and Uncertainty
Handle early-season and low-minute football data with explicit exposure rules, sensitivity checks and cautious language.