
Shots on target percentage describes where attempts finish, but volume, location, shot type and sample size determine what the percentage can support.
A practical guide to reading shots on target percentage alongside attempts, goals, expected goals and minutes—without turning one ratio into a finishing verdict.
There is a seductive neatness to shooting accuracy. One player puts half his attempts on target; another manages a third. The first number is larger, so the first player must be the better finisher.
That conclusion has skipped almost the entire attack.
Shots on target percentage is useful because it connects on-target attempts with overall shooting volume. In the current FBPlot catalog, Shots on Target % is a percentage metric rather than a per-90 count. It answers a narrow question about the selected attempts. It does not, by itself, tell us where those shots came from, how difficult they were, whether they became goals, or whether the sample is stable.
A Percentage Can Hide the Number of Attempts
Suppose one forward puts two of four attempts on target and another puts 20 of 50 on target. The first percentage is higher. The second player has sustained the behavior over a much larger sample and produced far more on-target attempts.
Neither comparison is complete without the counts.
Whenever a shooting percentage drives the sentence, keep these fields within reach:
- total shots;
- shots on target;
- minutes or matches;
- goals and expected goals;
- the period and competition scope.
This is the same reason a save percentage is not read without shots faced. A ratio describes composition, not workload.
On Target Is Not the Same as Dangerous
An attempt can be on target and still be easy to save. Another can miss by a small margin after forcing a difficult action from a valuable location. Shots on target percentage knows the outcome category, not the full quality of the chance.
Expected goals adds a different layer by estimating the likelihood of a shot becoming a goal under a defined model. It should not be used as a perfect judge of technique, either, but it helps separate shot selection from the simple on/off-target distinction. Our expected-goals chart guide explains how totals and rates change that reading.
Use shooting accuracy to describe where attempts finished. Use chance-quality measures to describe the opportunities being attempted. Use goals to describe the realised outcome. Mixing those layers creates confident but vague language.
The Role Creates the Shot Menu
A centre-forward receiving cut-backs and a winger shooting from the corner of the box do not receive the same menu of attempts. A midfielder attempting from distance may post a lower on-target rate because the role encourages lower-probability shots under different pressure.
That does not make role an excuse for every result. It makes role part of the comparison contract.
Before ranking players, align the broad position group and ask whether their shot locations and types are reasonably comparable. If not, describe the contrast rather than presenting the percentage as a clean contest.
Read the Metric Inside a Profile
The production FBPlot Standard radar below includes Shots on Target % among a broader attacking and possession profile. The chart demonstrates why the percentage should remain one axis rather than becoming the entire verdict.
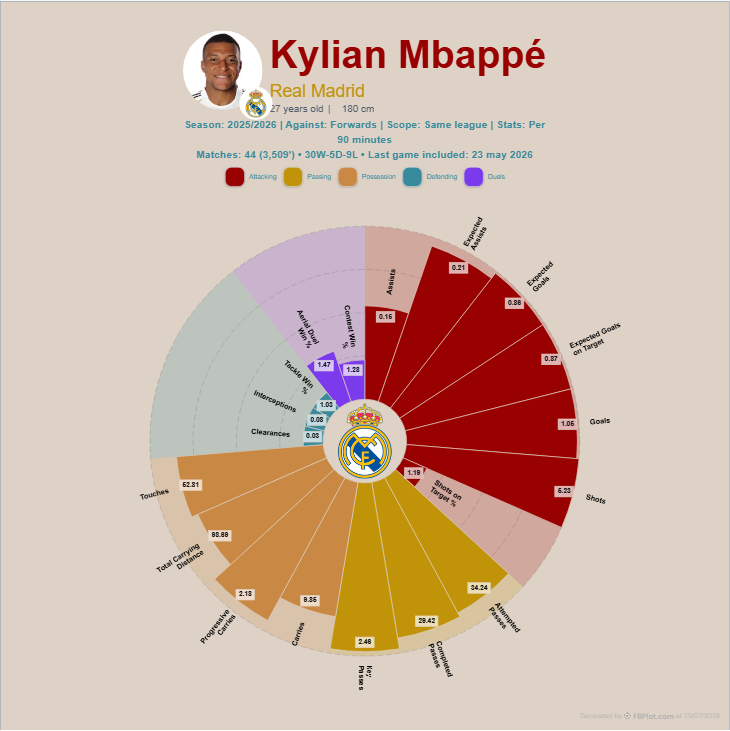
The surrounding axes do not “correct” the percentage. They stop it from carrying claims it cannot support. A shooting observation can be tested against volume, expected output and the player's wider involvement.
Three Different Questions, Three Different Views
Use absolute values when the story concerns accumulated attempts or on-target shots across the period. Use per-90 counts when the story concerns shooting frequency while on the pitch. Use Shots on Target % when the story concerns the share of attempts that reached the target.
Do not calculate a per-90 percentage. FBPlot deliberately treats the current percentage metric as unsupported for per-90 mode because it is already a ratio. Normalising a ratio by playing time would produce a number with no useful football interpretation.
The same caution applies to team contribution. A player's share of team shots on target can be meaningful, but that is a different measure from the percentage of the player's own shots that were on target.
When a High Percentage Should Make You Curious
A strikingly high rate should trigger questions, not immediate praise:
- Is the sample only a handful of shots?
- Does the player avoid speculative attempts?
- Are most attempts headers, close-range finishes or set pieces?
- Has the role changed during the period?
- Is the player selecting shots so cautiously that total threat falls?
The mirror image matters too. A low percentage may reveal poor execution, difficult shot selection, a tactical instruction to shoot early, or simply noise. The chart identifies the pattern; match review helps explain it.
Pair Accuracy With Outcome and Process
A compact shooting panel can contain four rows:
- shots per 90 for frequency;
- shots on target percentage for placement category;
- expected goals per shot or another available chance-quality measure;
- goals or goals minus expected goals for realised outcome, read cautiously.
Add minutes and the comparison population in the caption. If the panel is being used to compare forwards, keep the role and competition scope coherent.
The companion guide to Goals + Assists shows how this process layer improves an outcome-led profile.
The Honest Sentence
“Player A has better shooting accuracy” is usually too broad. A more defensible statement is:
During this period, a larger share of Player A's recorded attempts were on target; the players' shot volume, chance quality and roles still need to be compared before drawing a finishing conclusion.
That sentence sounds less dramatic because it respects what the metric actually contains.
Build the shooting view in the FBPlot Player Pizza Chart or Player Bar Chart. Keep attempts and minutes visible, then decide whether the percentage changes the analysis or merely decorates it.
Found this helpful? Share it with your network
More Articles
Key Passes vs Expected Assists: Two Views of Chance Creation
Key passes count chances created; expected assists weights their estimated quality. Read them together to separate creative volume from chance value.
Progressive Carries by Role: Winger, Midfielder and Full-Back
A progressive carry means something different when it begins on the touchline, escapes pressure in midfield or creates an overlap from full-back.