
Goals minus expected goals describes conversion above or below a model's pre-shot expectation. It is not automatically a stable finishing rating.
Learn how to read G-xG with shot volume, chance mix, penalties, minutes, post-shot execution and sample size before making player claims.
A striker has six goals from four expected goals. The subtraction is easy: plus two. The interpretation is where the work begins.
Goals minus Expected Goals—often written as G-xG—compares realised goals with a model's estimate of pre-shot chance quality. A positive value means more goals were scored than the model expected from the selected chances. A negative value means fewer.
That is a useful description of the sample. It is not yet proof of a permanent finishing trait.
What the Difference Measures
If a player records 10 goals from 8 xG, G-xG is +2. If another scores 6 from 8 xG, the difference is -2. The arithmetic preserves direction and scale in goal units.
The number inherits every choice inside the xG model and dataset: provider, competitions, dates, penalties and which shots were included. It should never be copied without that context.
FBPlot's current catalog exposes Goals minus Expected Goals as its own attacking metric. It does not support team-contribution mode, because a difference between outcome and expectation is not naturally the same kind of share as a count.
The Same Gap Can Come From Different Shot Profiles
Imagine two players at +3. One took a modest number of high-quality chances. The other took many low-value shots and converted several spectacular efforts. Their total overperformance matches, but the route does not.
Read G-xG beside:
- total goals and xG;
- shots and average chance profile where available;
- minutes and starts;
- penalties and set-piece responsibility;
- expected goals on target for on-target execution.
The difference becomes more informative when you can explain what produced it.
Small Samples Make Dramatic Stories
One long-range goal can move G-xG sharply in a short sample. So can a missed penalty. Football's low-scoring nature makes outcome-minus-expectation metrics especially sensitive to a handful of events.
Do not solve this with a magic minimum number of minutes. Inspect the number of shots, the concentration of xG in a few chances and whether the pattern persists across periods. The small-sample guide explains why eligibility rules reduce some noise without making uncertainty disappear.
Positive Does Not Mean “Due to Regress” Tomorrow
Regression toward a more ordinary rate is a population tendency, not a timetable for the next match. A player at +4 is not mathematically required to miss enough chances to return to zero.
Likewise, a negative value does not guarantee future improvement. The player may be executing poorly, receiving unsuitable chances, carrying an injury or simply moving through normal variance. Analysis should identify plausible mechanisms rather than use “regression” as a prediction spell.
Put the Gap Inside a Forward Profile
This FBPlot bar chart shows an absolute-value forward profile. The purpose here is the layout: finishing differences should be read beside workload and opportunity rather than highlighted alone.
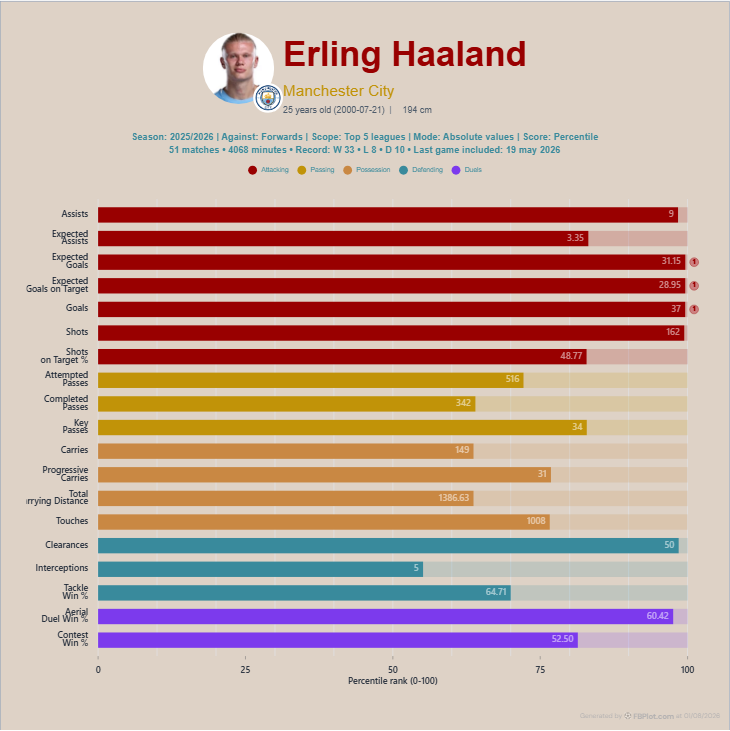
If the gap is the headline, a bar chart makes the underlying values easier to inspect than a shape. Keep goals, xG and G-xG adjacent so the reader can reconstruct the subtraction.
xGOT Adds a Different Test
G-xG combines finishing, goalkeeping outcomes and variance after the pre-shot chance. Expected goals on target adds information about where on-target shots were directed under a specific provider model.
If G-xG is positive while xGOT does not exceed xG, the goals may not be explained by consistently more dangerous on-target placement. If both gaps point the same way over a meaningful sample, the finishing hypothesis becomes more interesting—but still not permanent.
The xGOT versus xG guide separates those stages in detail.
Language That Respects the Sample
“Elite finisher” is a career-level claim. A seasonal chart may support a more limited sentence:
The player scored above the model's pre-shot expectation during this period. The gap is large enough to investigate, but the shot sample, penalty mix and post-shot evidence should be reviewed before treating it as a stable finishing skill.
That is still an insight. It simply leaves the future open.
For the wider role, continue with how to read striker statistics. Then open the Goals minus Expected Goals metric page and build an absolute-value Player Bar Chart that shows the difference with both of its components.
Found this helpful? Share it with your network
More Articles
Pass Completion Percentage in Football: Accuracy Without Ambition
Pass completion percentage measures successful attempts in a selected pass set. It does not reveal difficulty, direction, pressure or creative value.
Shots Off Target in Football: What the Stat Actually Tells You
Shots off target describe an attempt's outcome, not its danger or the quality of the finish. Read the number with volume, location, blocks and role.