
Produce a consistent weekly football graphic by freezing the question, configuration and review process while documenting every data refresh.
A recurring series should change because the period and data changed, not because hidden filters, metrics or design choices drifted between editions.
A recurring football graphic gains value through consistency. Readers learn what the series measures and can compare editions. Hidden changes to filters, metrics or layout break that continuity.
Treat the chart configuration as a source document: freeze the method, refresh the allowed inputs and log every change.
Define the Series Contract
Before the first edition, record:
- reader and editorial purpose;
- analytical question;
- competitions and population;
- period logic;
- eligibility rule;
- metrics and definitions;
- units;
- chart type;
- aspect ratio;
- title and caption pattern;
- update schedule.
If the question changes, create a new series rather than silently repurposing the template.
Separate Fixed and Variable Inputs
Fixed
- metric definitions;
- chart encoding;
- population logic;
- eligibility rule;
- visual hierarchy;
- annotation policy;
- output ratio.
Variable
- data cutoff;
- current period;
- eligible observations;
- highlighted subjects;
- edition-specific caption;
- documented corrections.
This distinction prevents weekly design work from becoming weekly methodology drift.
Start From the Glossary
Link every metric to the current Metrics Glossary. If a definition or product control changes, pause the series and document the revision.
The glossary-to-chart workflow provides the initial setup.
Choose a Durable Format
Select a ratio from the current FBPlot presets and test it with long names, dense values and the smallest expected destination.
The aspect-ratio guide and mobile label audit help stress-test the template.
Refresh in a Fixed Order
For each edition:
- record the new cutoff;
- refresh the selected period;
- apply the frozen eligibility rules;
- verify metric definitions and units;
- inspect population count and missing values;
- update highlights using the stated editorial rule;
- export the native chart;
- create any annotated derivative separately;
- review at destination size;
- publish with the edition log.
Avoid Winner-Driven Editing
Do not change the metric, threshold or period because the new leader is inconvenient. A series is credible when the method survives an unexpected result.
If a rule becomes inadequate, explain the reason, show the effect and version the methodology from that edition forward.
Handle Annotations Separately
Use the responsible annotation workflow. Preserve the native export and identify any callouts, fading or editorial labels added later.
Never move a plotted mark or edit a value for layout convenience.
Keep an Edition Log
Series:
Edition date:
Data cutoff:
Configuration version:
Population count:
Highlights:
Changes from previous edition:
Corrections:
Reviewer:
The log can remain internal, but the published caption should expose any change that affects interpretation.
Review Before Publication
Check:
- title matches the current population;
- period and cutoff are visible;
- highlighted subjects follow the rule;
- labels work at final size;
- colour is not the only cue;
- source and unit are available;
- conclusions describe, rather than predict, the data;
- the configuration can be reconstructed.
The reproducibility manifest provides the complete record.
What Should Change From Monday to Monday?
A recurring series is easiest to trust when the reader can predict its grammar. In this FBPlot landscape profile, the player block, metric order, colours, population line and Team Contribution mode form that grammar. A new edition may change the player, period and observed values; it should not quietly change the meaning of the chart because this week's result looked less dramatic.
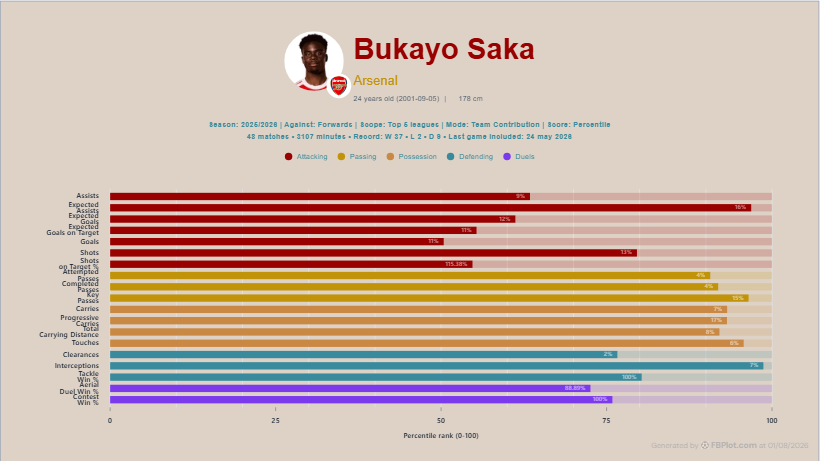
Imagine that the next edition features a midfielder. Reusing the colours and aspect ratio is sensible, but reusing a forward metric preset is not. The series contract must distinguish visual consistency from analytical consistency. Role-specific metrics may change according to a documented rule, while the unit, eligibility logic and caption structure remain stable.
The edition log should capture that decision in one line: “midfielder role preset applied; all other settings unchanged.” If a metric definition or product control changes, record a methodology version rather than hiding the break. Readers are more likely to return to a series that admits change clearly than to one whose historical graphics cannot be compared.
The most dangerous weekly change is often the cutoff. One edition may include Sunday evening matches while another stops on Saturday because the graphic is due earlier. A “latest” label hides that mismatch. Put the last included game or extraction date inside the export and keep the publication schedule separate from the data window.
Design changes deserve restraint as well. A new palette can refresh the series, but switching colours to favour the featured club makes the archive harder to scan and can imply value where none exists. Treat visual identity as a versioned template. Change it deliberately, announce the change once and keep the analytical encoding stable.
Build the Series
Create the first edition in FBPlot, export it in the intended ratio and store the configuration beside the file. Duplicate the process—not the final image—for the next edition. Consistency should come from a stable method with dated data, not from reusing an old graphic.
Found this helpful? Share it with your network
More Articles
How to Document a Reproducible Football Chart
Record the minimum information another analyst needs to rebuild a football chart: question, source, period, population, metrics, units and configuration.
Small Samples in Football Analytics: Minutes, Matches and Uncertainty
Handle early-season and low-minute football data with explicit exposure rules, sensitivity checks and cautious language.